How to make an America map that spans both hemispheres
An America map colors every country from Greenland and Canada down to Argentina and Chile, Caribbean islands included. It is the map for any story that runs from north to south.
One map, two hemispheres
The Americas stretch across more latitudes than any other continental map, which makes this one ideal for anything that changes from north to south: climate, seasons, daylight, the route of a long trip. It also puts Central America and the Caribbean right beside their big neighbors, where a world map would shrink them to specks.
The default projection is Natural Earth, which reins in the far north so Greenland does not dwarf the rest of the hemisphere. Equal area, Mercator and Flat are one click away under Projection in the Map section.
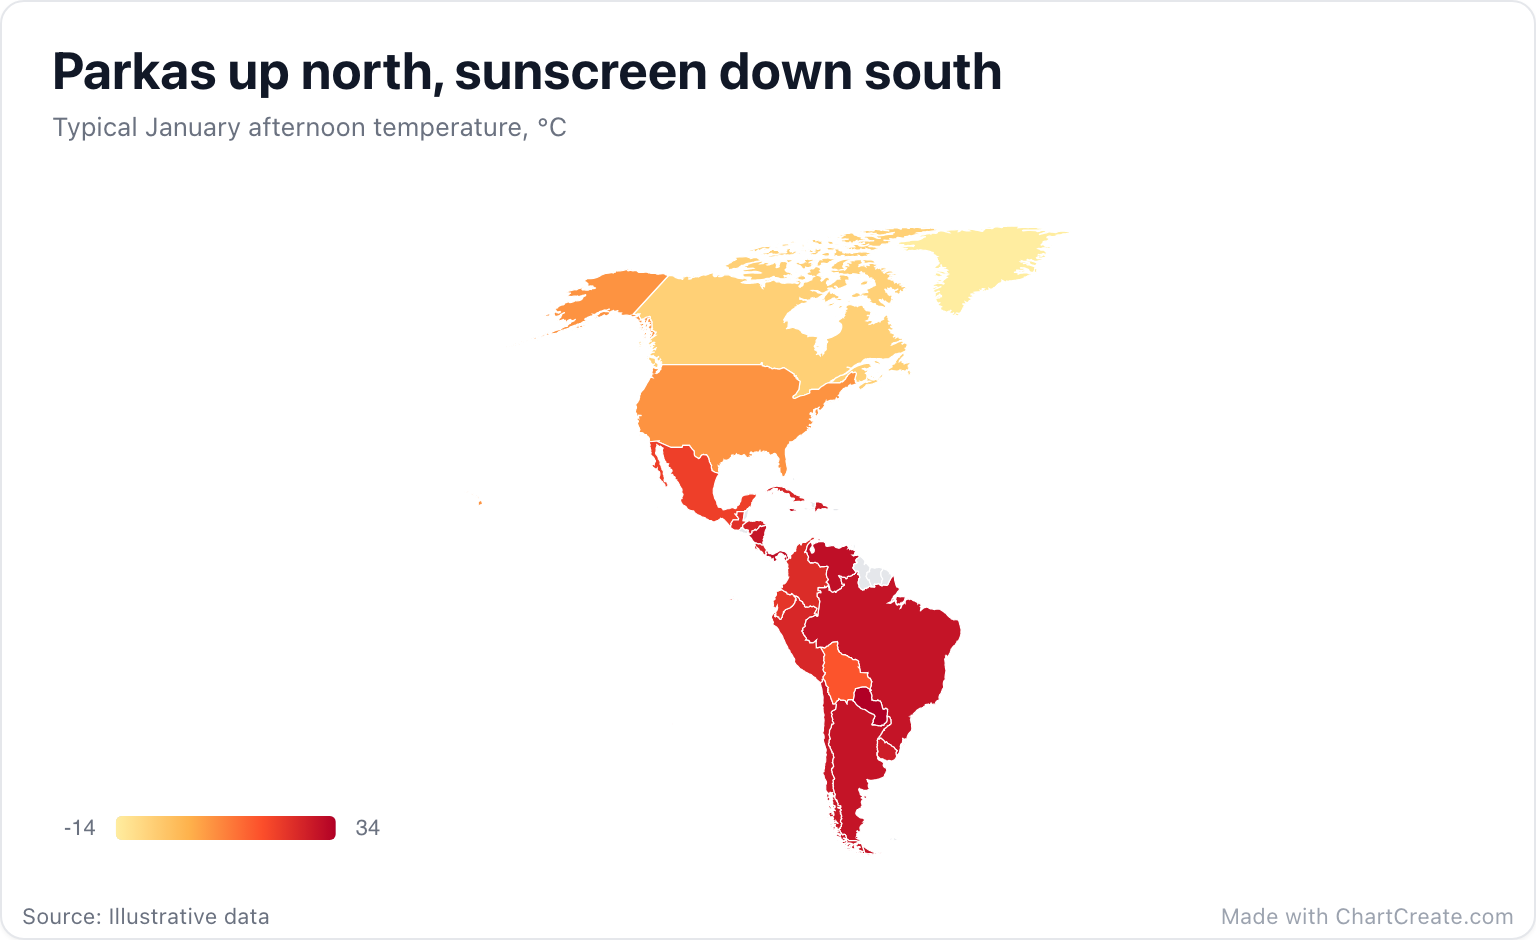
Reading the January map
January is midwinter in the north and high summer in the south, and the map shows the whole sweep at once: pale in Greenland at -14°C and Canada at -6°C, warming through Mexico at 21°C, and deep red from Panama and Venezuela at 31°C down to Paraguay, the hottest at 34°C. Bolivia, at 17°C, is a cooler patch in the middle of a hot continent, which is what the high Andes do to an afternoon. Negative numbers need no special handling: the scale simply runs from your lowest value to your highest. Countries without a row, such as Guyana and Suriname, stay gray, so a gap in the data never passes for a cool spot.
Gradient or steps
ChartCreate colors numbers in steps by default, four classes that readers can match against the legend. The January map switches Scale to Gradient instead, a smooth ramp with the lowest and highest values printed at its ends. Temperature flows continuously, and here the sweep matters more than the exact band any one country falls in.
Use a gradient when the sweep is the story, and steps when readers need to look a value up.
Whichever you choose, make the colors mean something. The Heat scale, pale yellow to dark red, reads as temperature without a legend. Blues would suit rainfall, Greens forest cover. A scale that fights its subject makes the reader work twice.
Getting the data in
Type or paste two columns, or import a CSV or XLSX file. Names are matched in English, Spanish, Portuguese, French and German, so México, Brasil and Perú all work, and so do two- and three-letter ISO codes for the most-used countries; the example uses US, CA and BR. Numbers can keep their thousands separators. Rows that match no country are highlighted in amber in the Data tab.
On this map the United States is one country among many. For data by state, switch to the US map, which has all fifty states plus DC. Small islands such as Barbados or Grenada are on the map but tiny at this scale, so if one of them matters, turn on Values on map or mention it in the subtitle.
When to use a different chart
A map shows one moment. To show how temperatures change through the year, a line chart with a line per city tells that story far better. To compare a few countries precisely, use a bar chart. When the map is right, download it as a PNG, JPG or SVG, sized for a slide or a social post. It is free with no account, and every export carries a small "Made with ChartCreate.com" credit.