How to make a pie chart that earns its slices
Pie charts get a bad rap. Used well, on the right data, they make a single point beautifully.
The pie chart is the most misused chart there is, but that is not the pie’s fault, it is ours. A pie does exactly one thing well: it shows that a few parts add up to a whole, and roughly how big each part is. "Organic search is about half our traffic" is a perfect job for a pie.
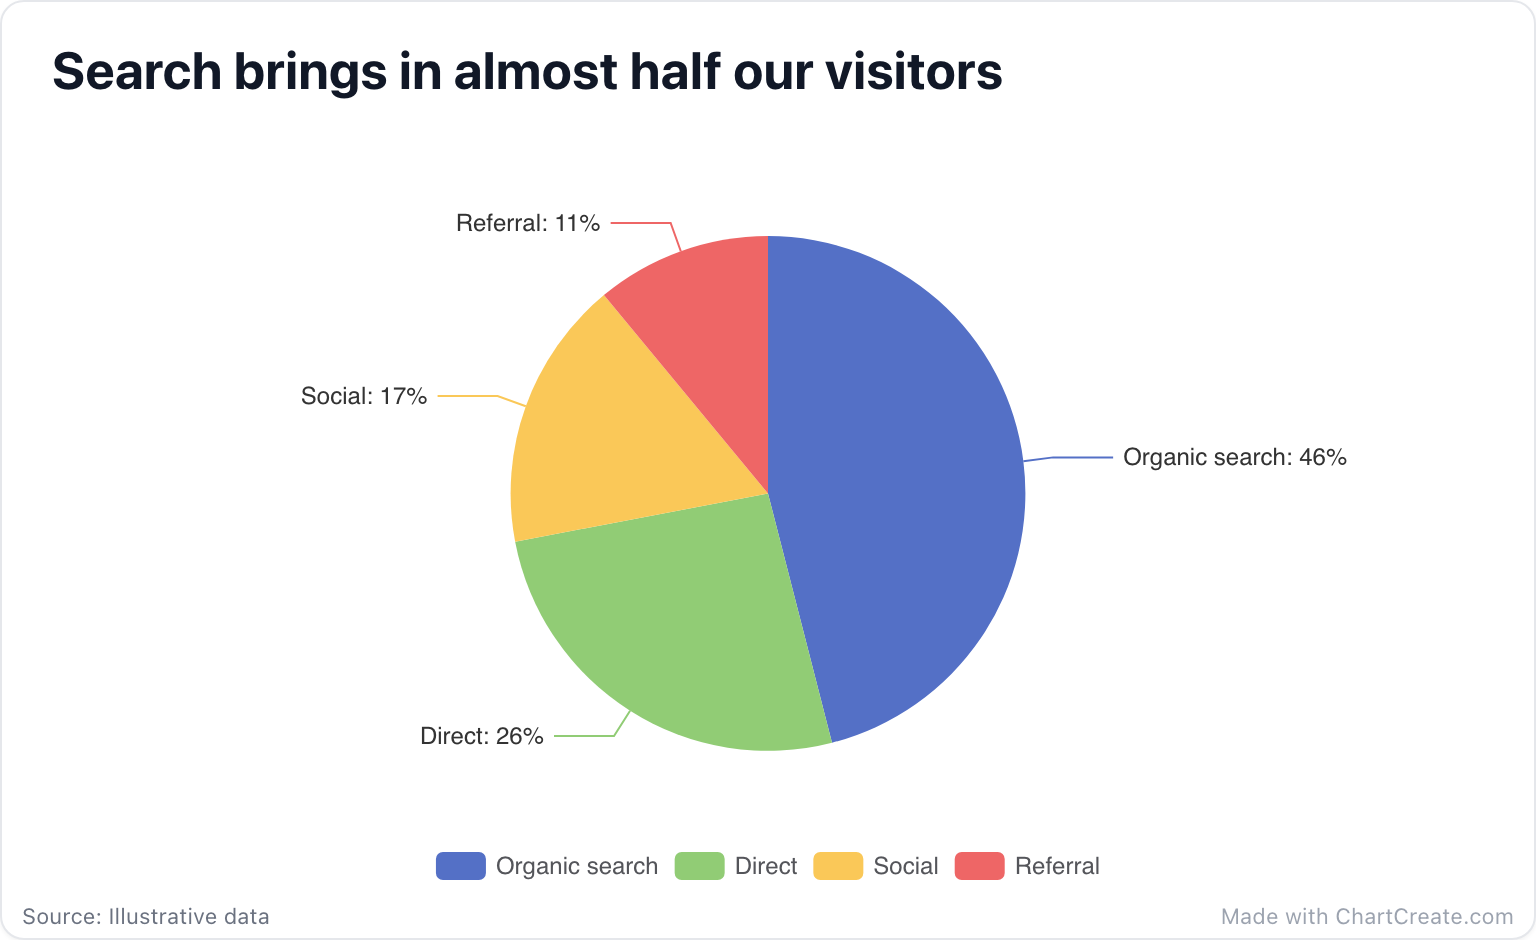
A pie chart is for a glance, not a measurement. If your reader needs the exact numbers, give them bars.
The two-to-five rule
Pies work when you have between two and five slices. Beyond that the slices get thin, the colors start to blur together, and nobody can tell the nine percent slice from the eleven percent one. If you find yourself with eight categories, group the small ones into an "Other" slice, or switch to a bar chart and compare them properly.
Doughnuts and labels
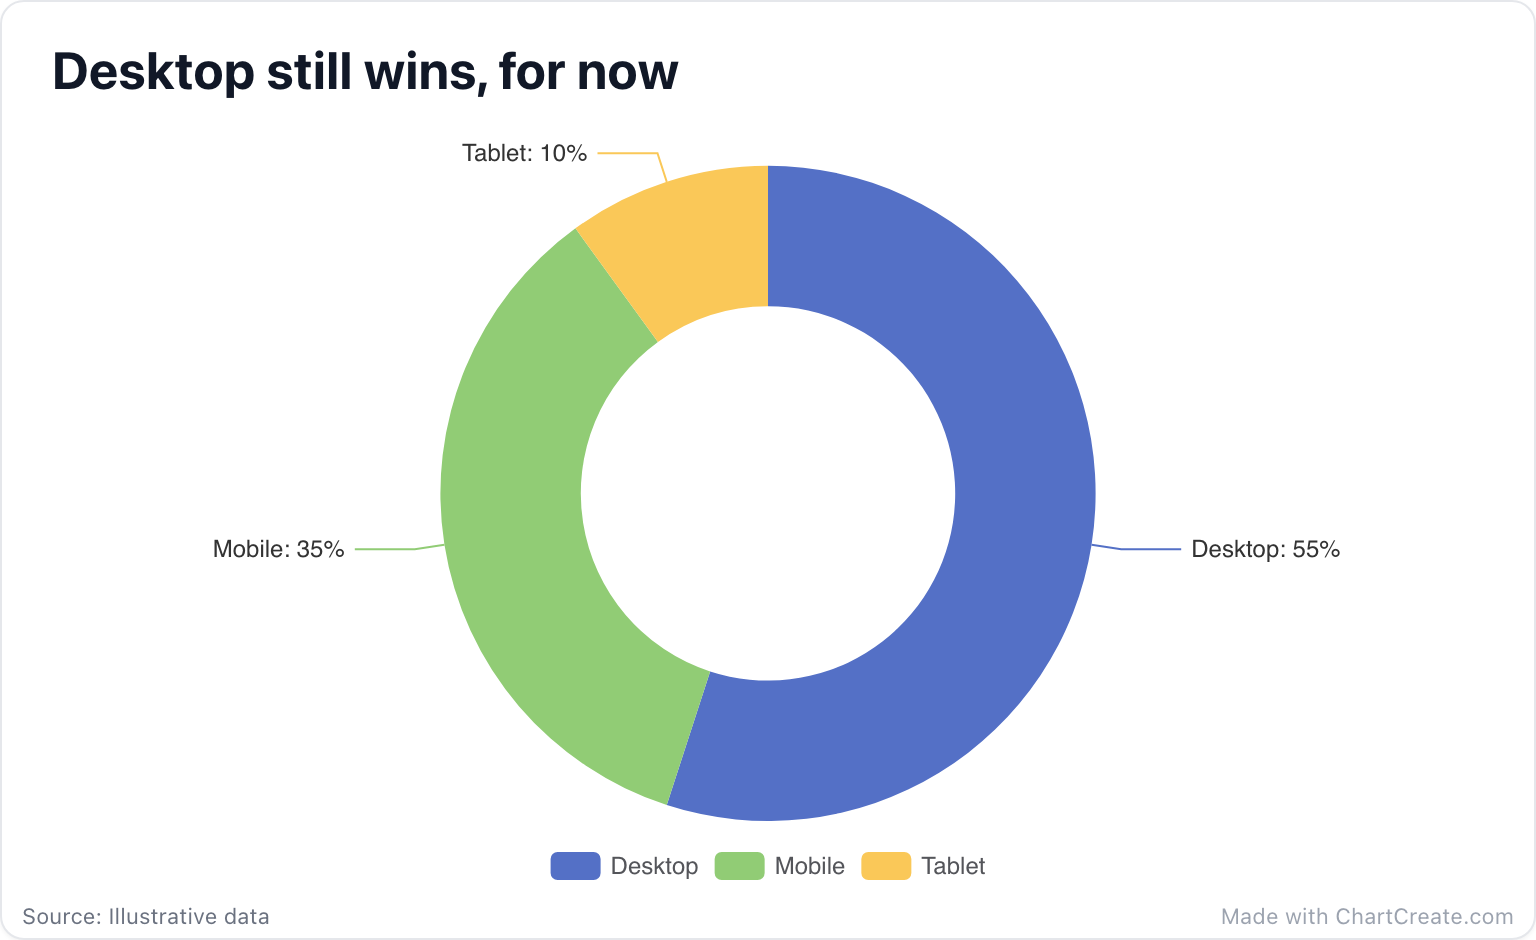
A doughnut chart is just a pie with the middle removed. The hole gives it a calmer, lighter shape that sits well next to text. In ChartCreate you can place slice labels outside with leader lines, which is best for longer names, or inside the slices, which looks cleanest when the slices are large. The percentages are worked out for you.
Make it click
Pick a palette that gives each slice a clearly different color, and write a title that states the takeaway rather than the topic: "Most of our traffic comes from search" beats "Traffic sources." Paste your data from a spreadsheet, turn off anything you do not need, and export a PNG or SVG when it looks right.
Colors, and where it will live
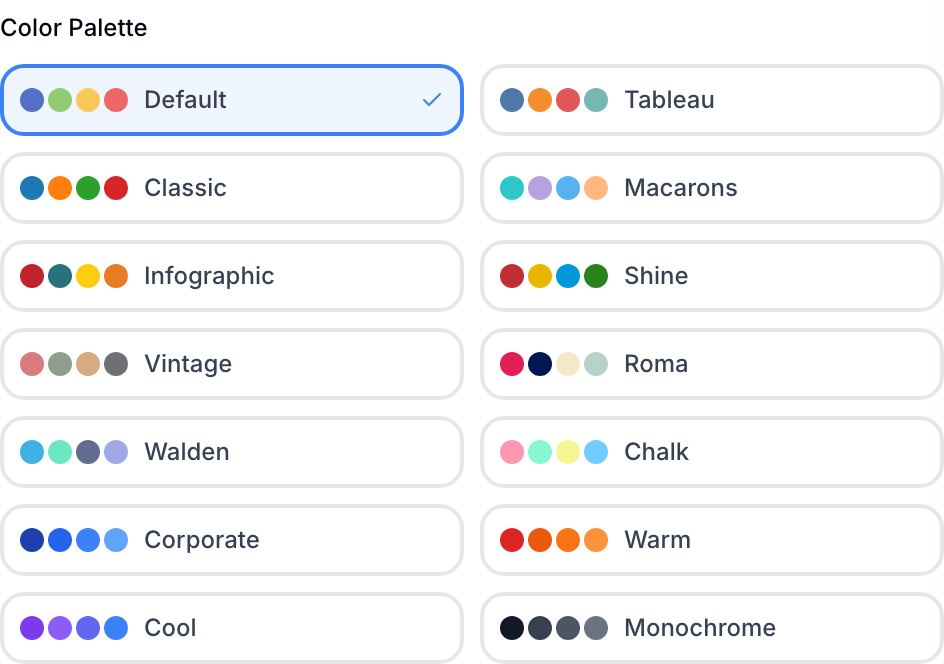
Fourteen built-in palettes cover most needs, from muted corporate tones to bright infographic colors, and you can click any color swatch to pick your own for a closer brand match. Think about where the chart will end up, too. ChartCreate has ready-made export sizes for a square Instagram post, a Twitter card, or a 1080p slide, so you can size it correctly up front instead of cropping it later. Move the legend to whichever side has room, and the pie shifts over to make space for it.
Good ideas for a pie
Market share between a few competitors. A budget split across departments. Answers to a yes, no, or maybe survey question. The device breakdown of your visitors. The common thread is always the same: a single whole, a few parts, and a point you can make in one sentence.