How to make an alignment chart worth arguing about
An alignment chart sorts people, characters or habits into a grid, from Lawful Good to Chaotic Evil. It began in a tabletop game and became the internet's favorite way to start a friendly argument.
How to read an alignment chart
The classic grid asks two questions at once. Across the top: does this person follow the rules (lawful), shrug at them (neutral) or ignore them completely (chaotic)? Down the side: do they mean well (good), look out for themselves (neutral) or cause harm on purpose (evil)? Every box answers both questions, so Lawful Evil does damage strictly by the book, and Chaotic Good breaks every rule to do the right thing.
The corners are where the jokes live. The center box, True Neutral, belongs to whoever just wants to get on with their day.
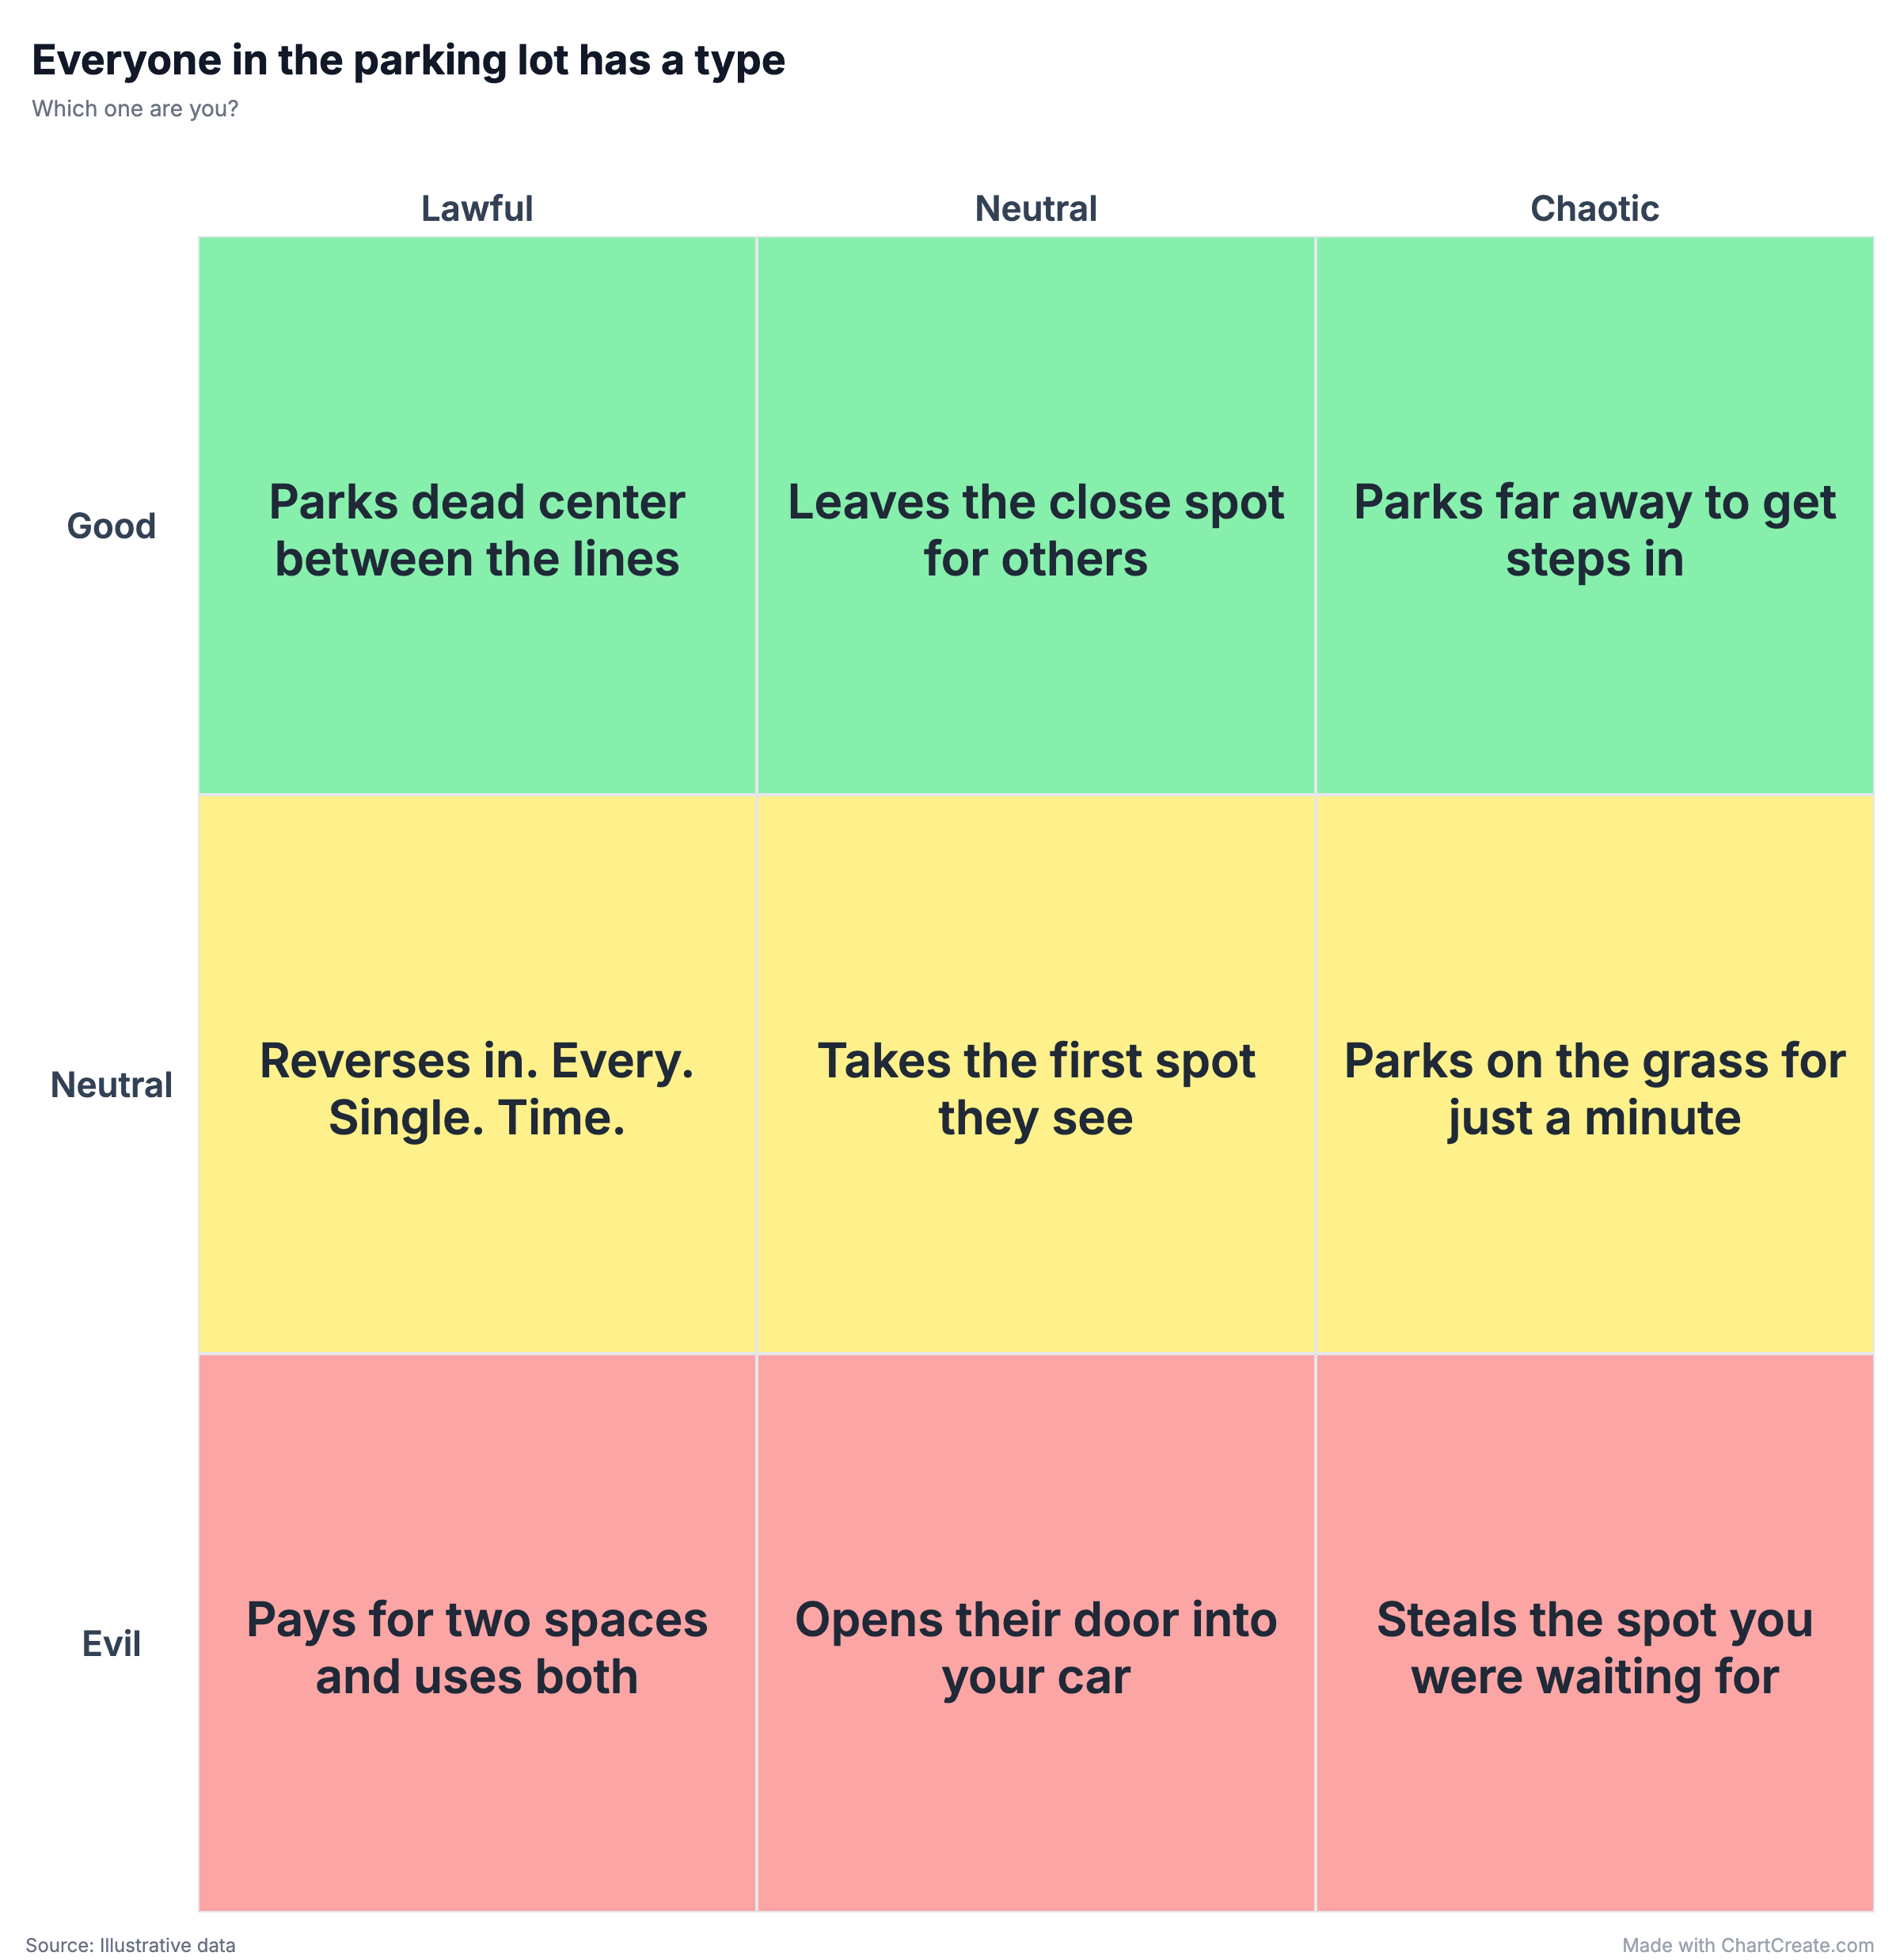
Read the parking chart one column at a time and the axes explain themselves. The lawful column is all procedure: dead center between the lines, reversing in every single time, paying for two spaces and using both. The chaotic column has the same energy and no rulebook, from parking far away to get steps in to stealing the spot you were waiting for. That is the test of a good alignment chart: once you see each box, it feels obvious, and a little too accurate.
Put behaviors in the boxes, not people you have to see on Monday.
Your own axes
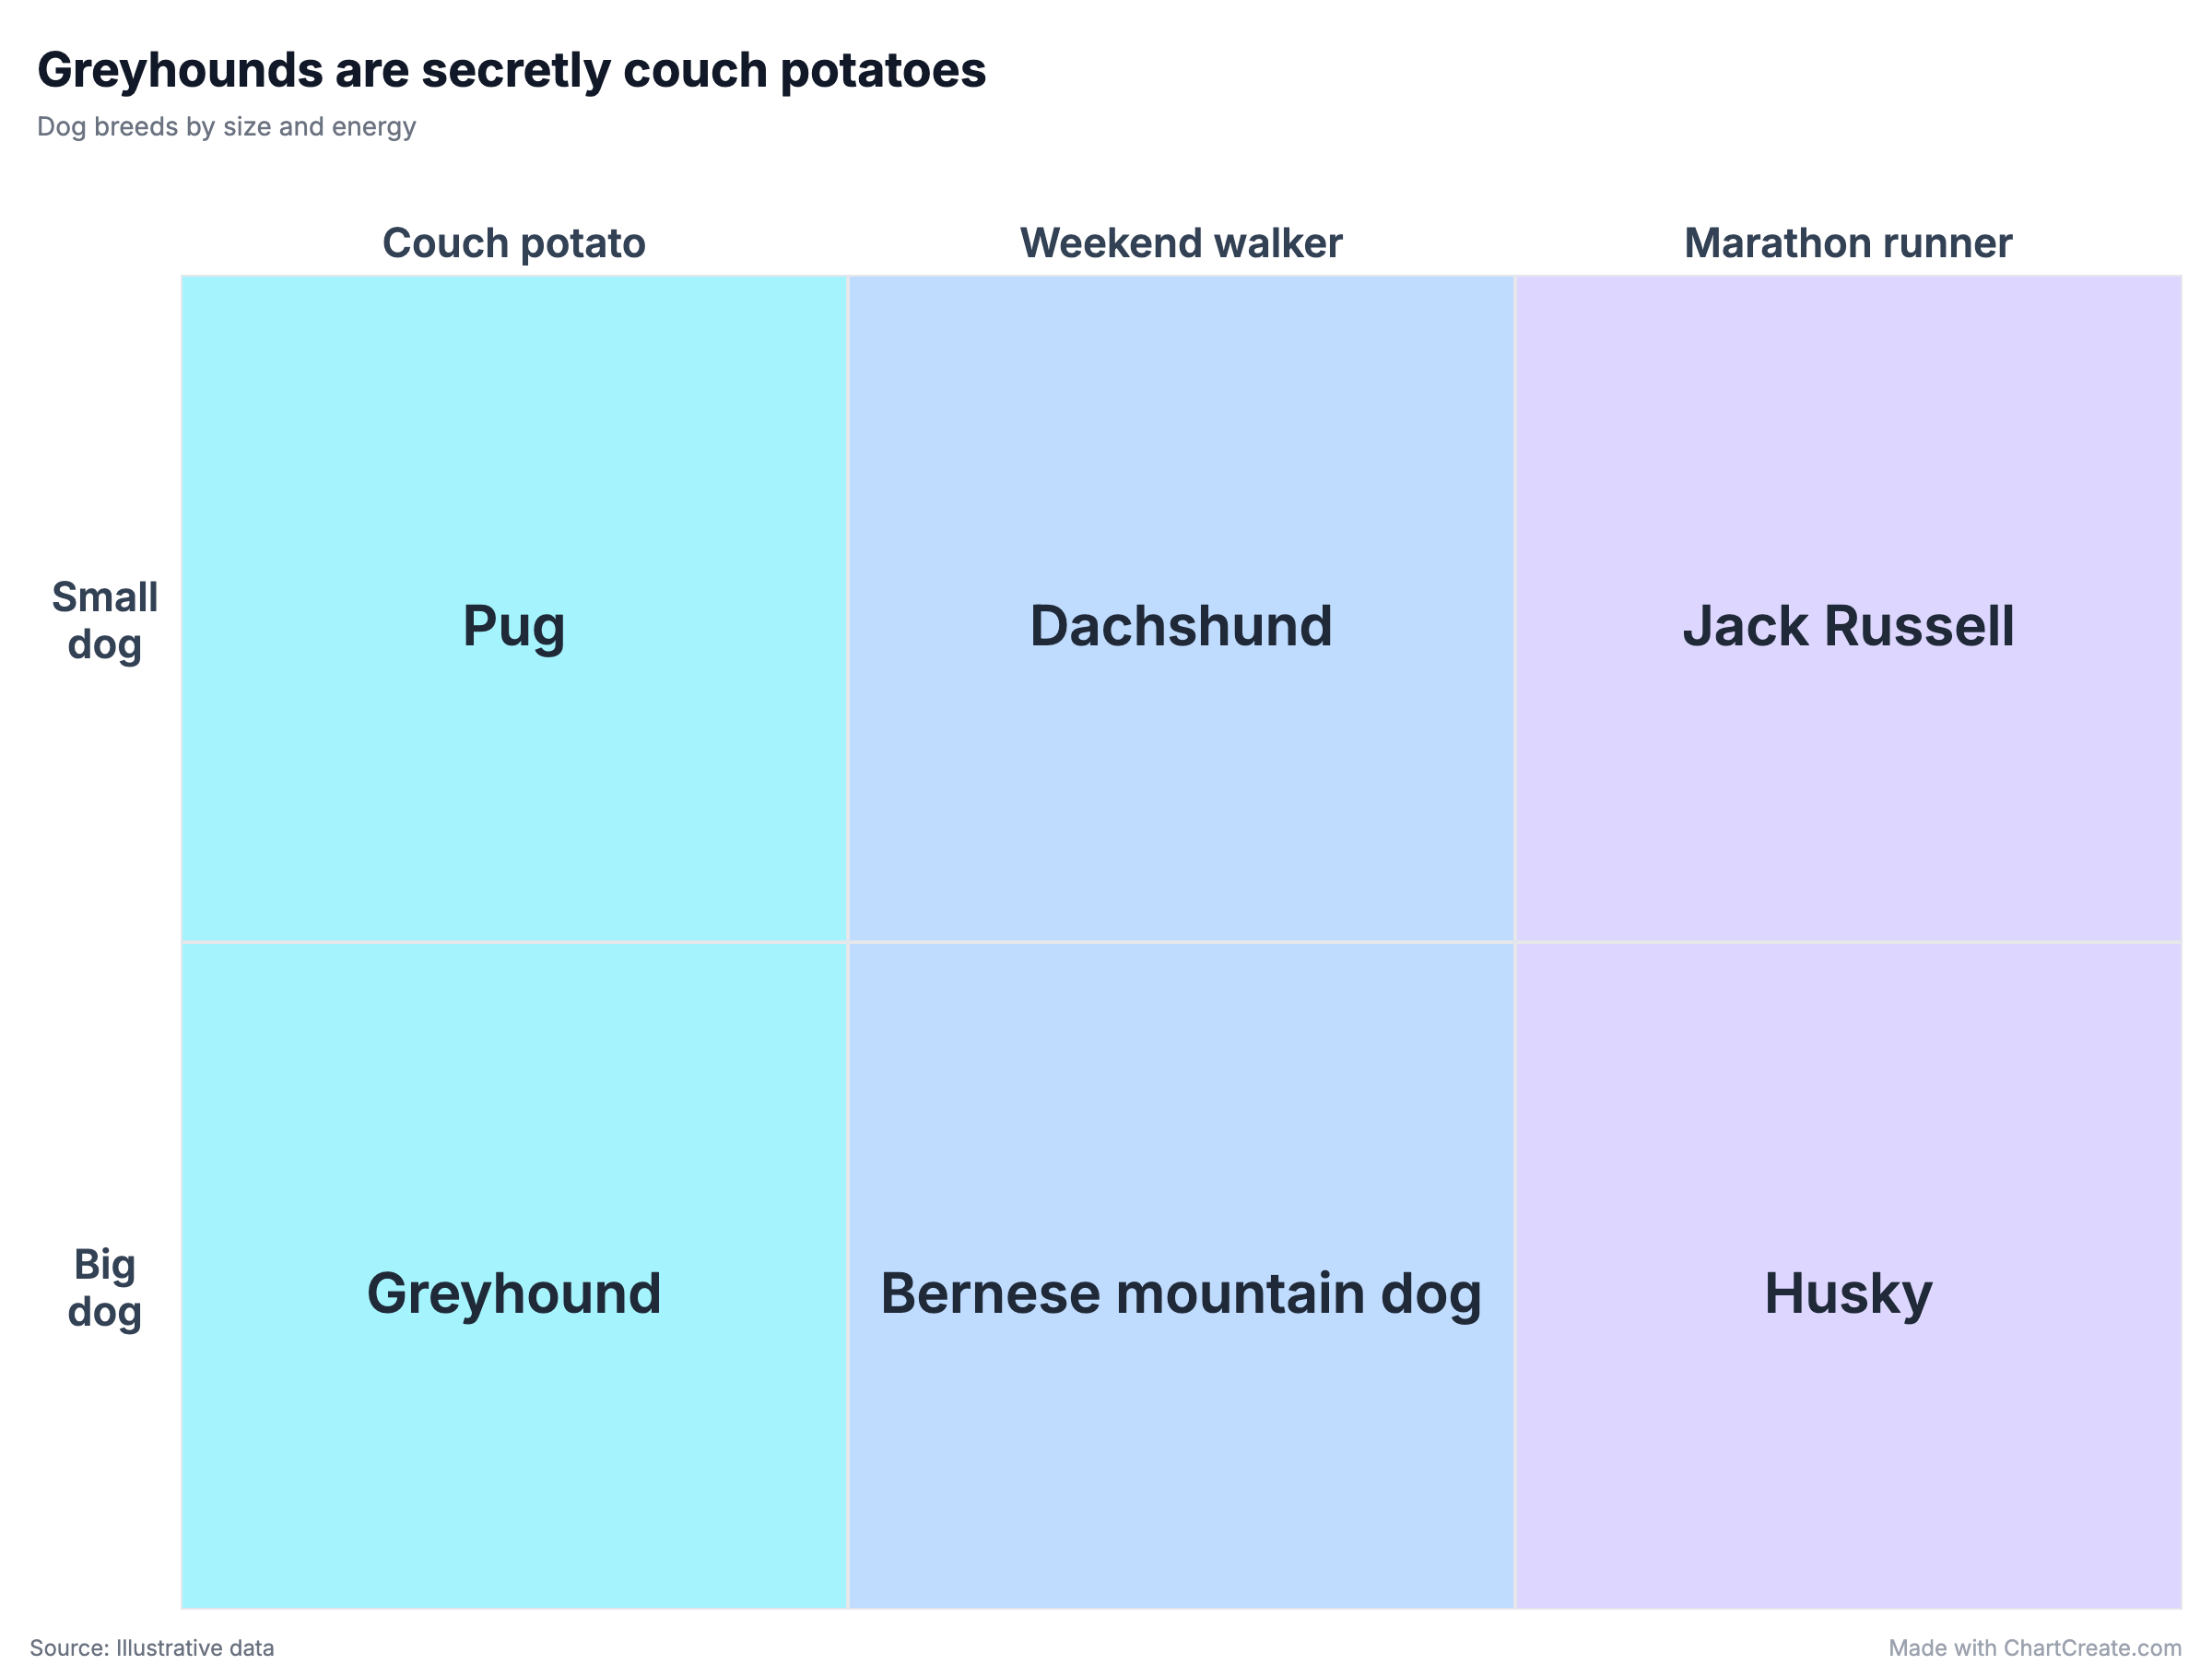
The nine-box grid is the famous one, but the format is just two axes and the boxes where they cross, so the labels are yours to change. A grid here can be anything from 2 by 2 to 5 by 5. The dog chart below uses two rows for size and three columns for energy, and it makes a point the classic grid never could: the greyhound, built for the racetrack, lands firmly in Couch potato.
Custom axes earn their keep at work too: effort against impact for a project list, cost against risk for the options on the table. If you would rather start from a known grid, the templates below set up the D&D classic, the political compass and a few other favorites in one click.
Know when to reach for something else. If you have real numbers for both axes, a scatter chart places each item at its exact position instead of rounding it into a box. If you are ranking things on a single scale, best to worst, that is a tier list.
When the boxes are too small: free placement
Some arguments are about degree, and a grid cannot show degree. The political compass is the famous case: two axes cross in the middle, and what matters is how far left or how far up something sits, never just which box it fell into. Switch Layout to Free placement in the Data tab and the grid becomes a plane with four colored quadrants, where every item goes exactly where you put it.
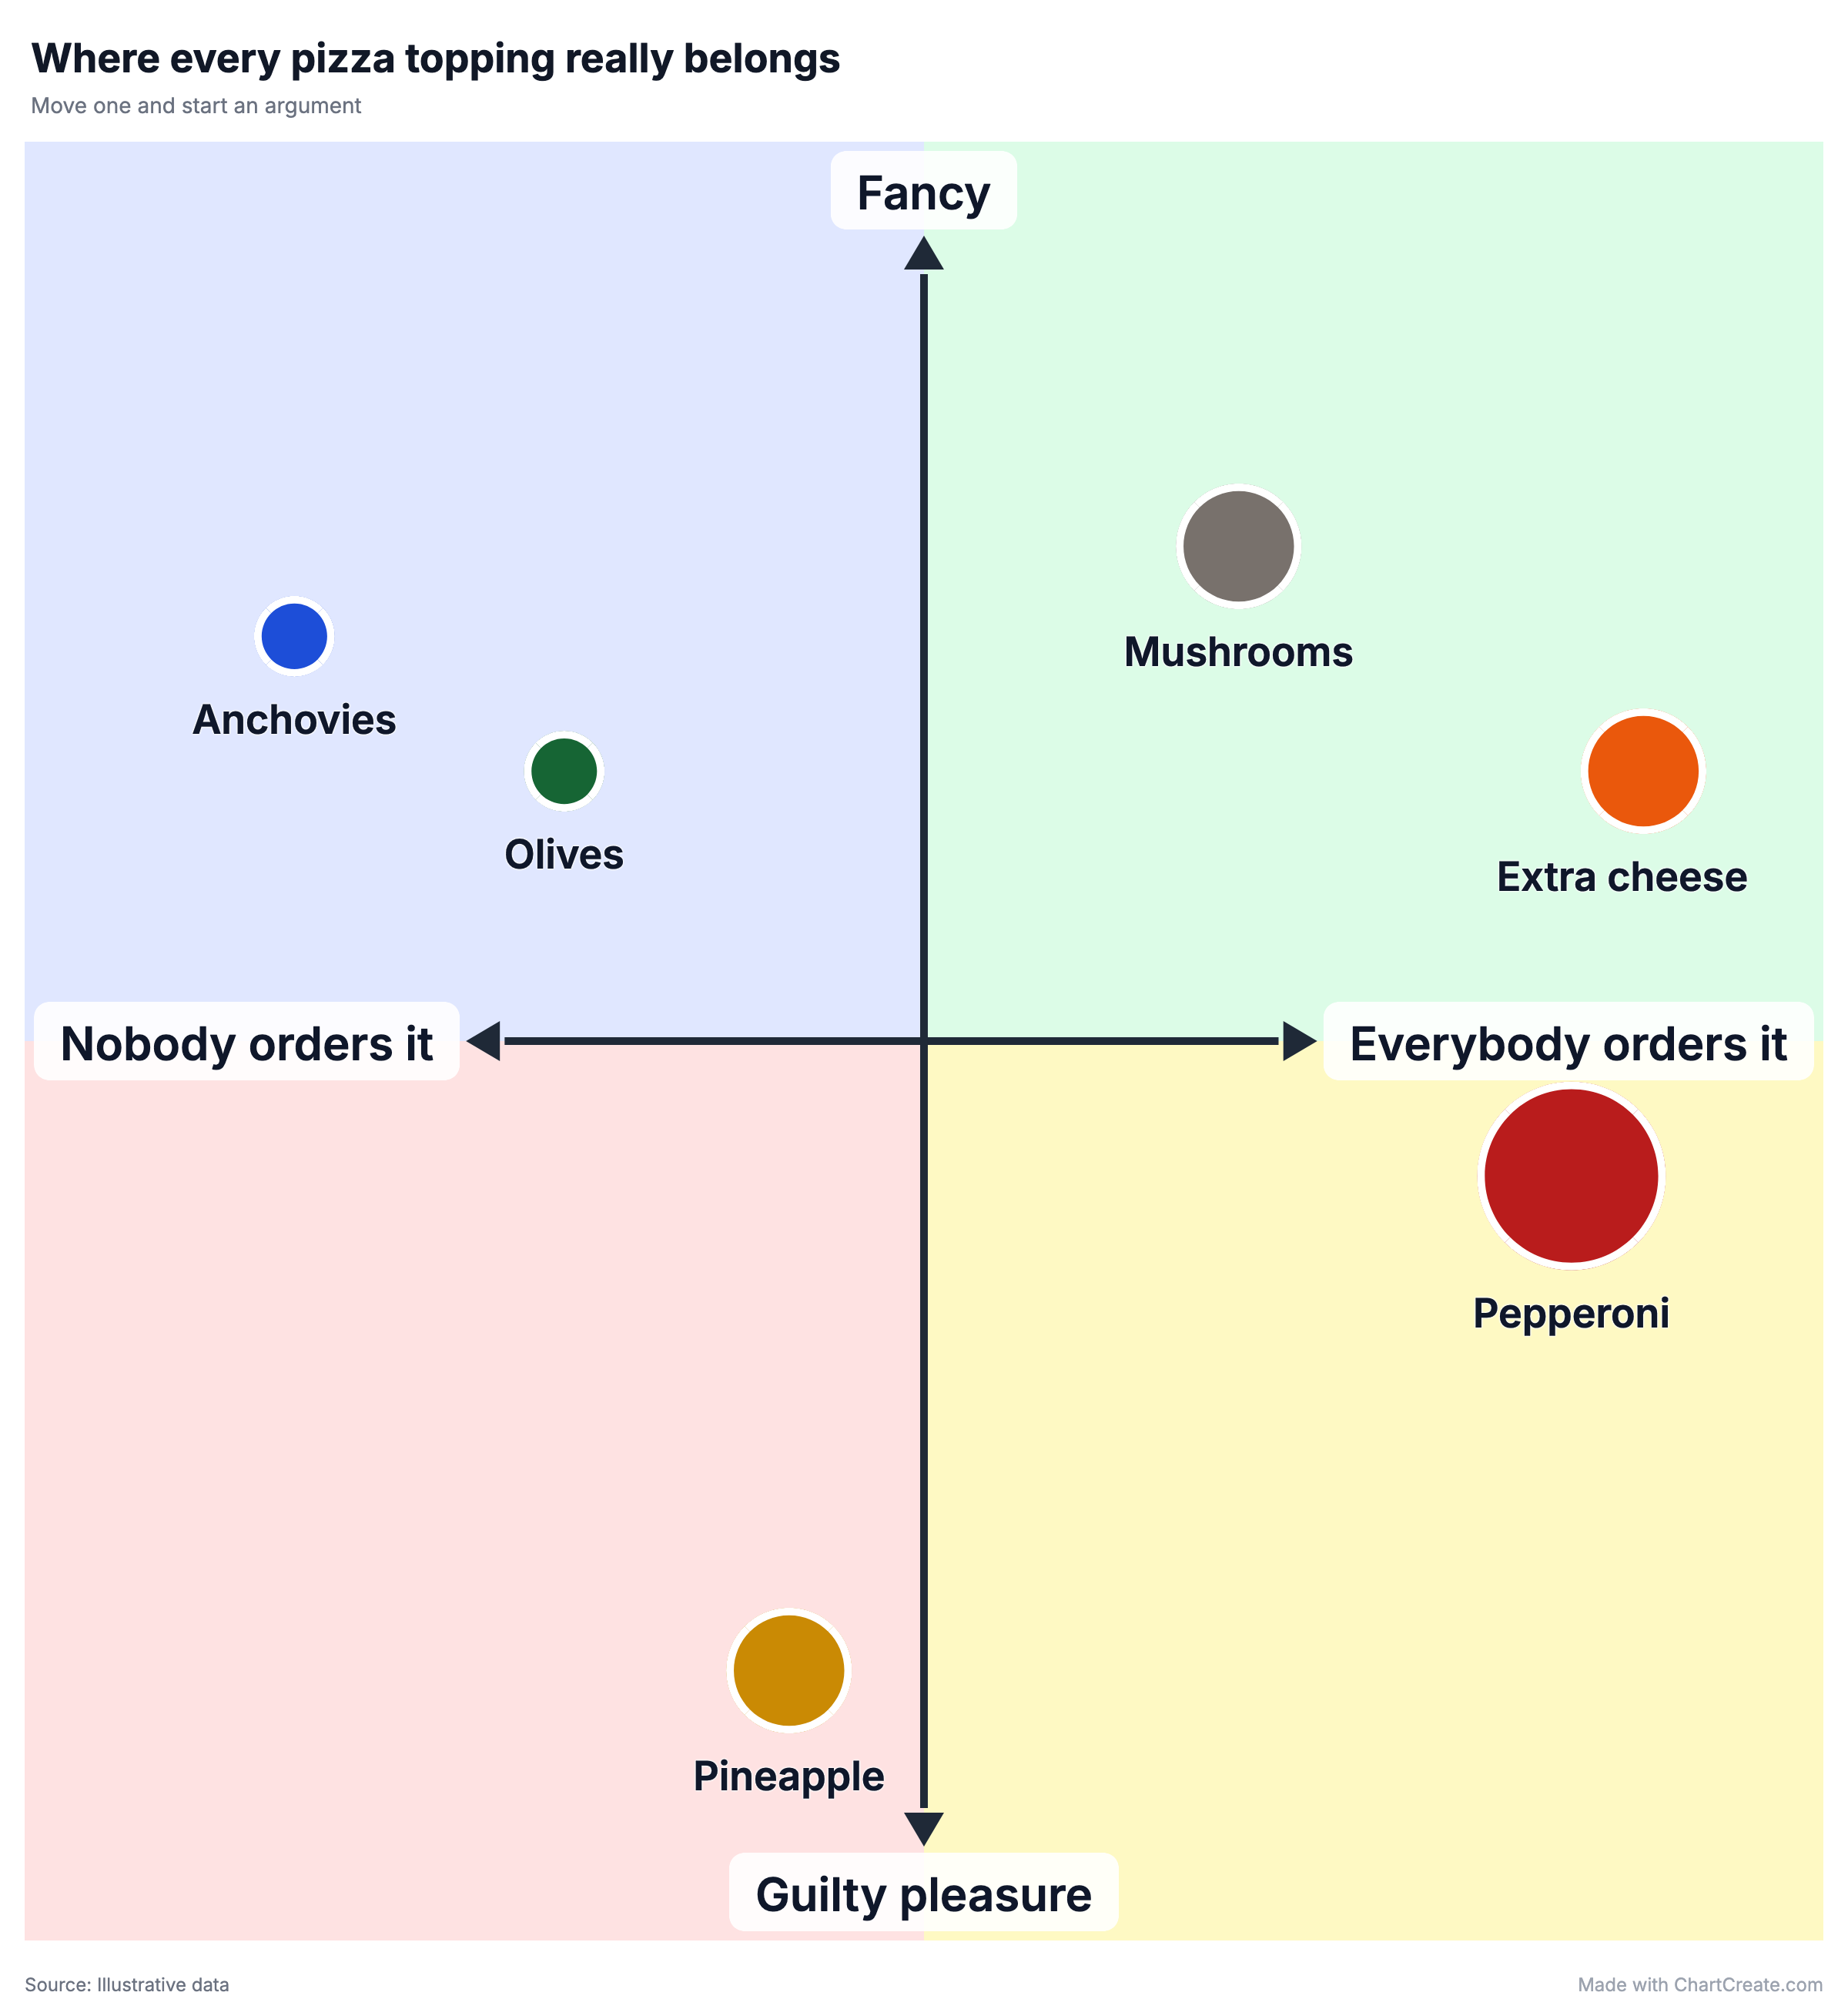
Click or tap the plane to drop an item and type its name, then drag it where it belongs. Arrow keys nudge a selected item and Delete removes it. Each item can carry a picture, a color and one of three sizes, and the four labels at the ends of the axes are edited right on the chart. Your grid is still there when you switch back: each layout keeps its own content.
Making one in ChartCreate
Most of the work happens on the chart itself. Click a box to type in it, click a row or column label to rename it, and drop or paste pictures straight into a box, up to four per box. When the group changes its mind, drag a picture from one box to another. The Data tab holds the same grid as a form, along with the grid size and the template menu.
Grid Coloring spreads the palette by row, by column, along the diagonal or as one solid color, and any box can take its own color from the picker on the board. The Classic palette runs from green through yellow to red, which suits good to evil perfectly. Set the title and an optional description in Grid Options.
When it looks right, download a PNG or JPG. If it is headed for Instagram or Reddit, pick the square or portrait shape first: the board is padded to fit, so nothing gets cropped. It is free with no account, and every image carries a small "Made with ChartCreate.com" credit.
For TikTok, Reels or Shorts, choose Reveal video in the Download menu instead. The cells appear one at a time, in reading order, so the bottom right corner gets the last laugh. It downloads as a video or a GIF, and a 9:16 shape is there for vertical feeds.
Two ways to ruin the joke
Too many words. A box holds a short phrase comfortably; longer text shrinks to fit, and a whole sentence turns into fine print that nobody reads. Aim for a phrase, a name or a picture.
Axes that blur together. If nobody can say why something sits in Neutral Good rather than Lawful Good, the chart stops being a joke and turns into a puzzle. Make the two axes measure different things, and check that each row and each column has a personality of its own.