How to make a bar chart people read at a glance
The bar chart is the workhorse of data visualization. When you are not sure which chart to use, a bar chart is almost never the wrong answer.
People read a bar chart by comparing lengths, and length is something our eyes judge quickly and accurately. There are no angles to estimate, no color scale to decode, no legend to memorize. You glance at it and you know which one is bigger, and roughly by how much.
What it is good at
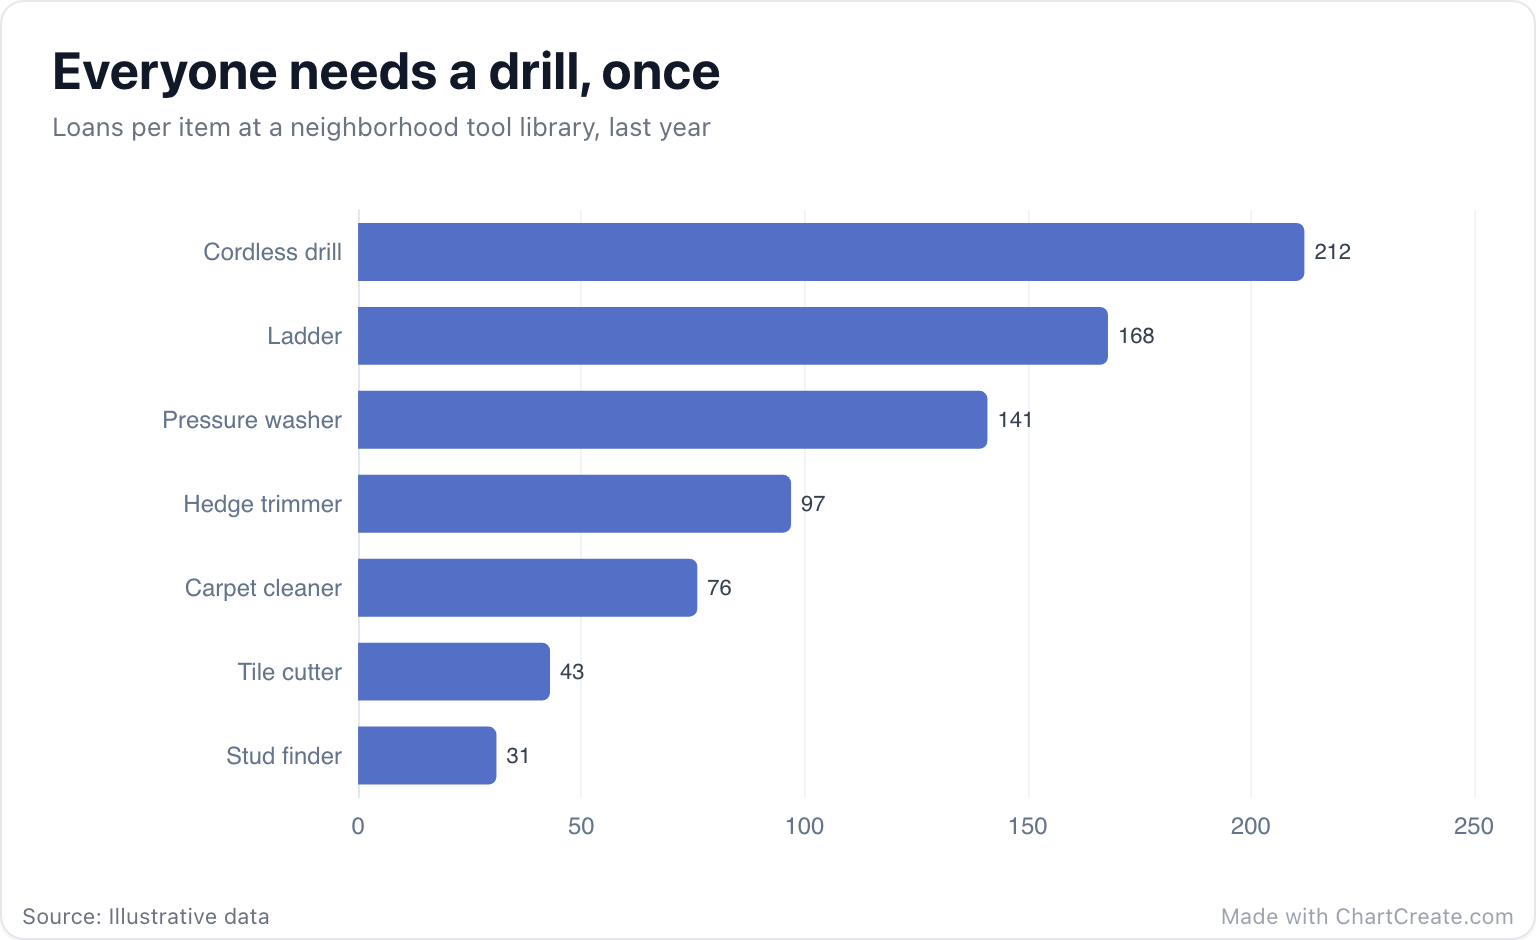
Reach for a bar chart whenever you compare one number across separate things: loans per tool, votes per candidate, revenue per product, answers per survey option. It works best with roughly three to fifteen bars. With more, keep the top ten and group the rest, or split them into a second chart. The tool library above makes its point in one look: the drill gets borrowed almost seven times as often as the stud finder, 212 loans against 31, because everybody needs a drill once and nobody needs one twice.
The rule you must not break: bars start at zero. The length of a bar is the message, so a value axis that starts at 50 makes 60 look twice as big as 55. ChartCreate starts bars at zero by default. You can set your own minimum in the Axis & Grid section, but for bars, think twice before you do.
If you can say it with a bar chart, say it with a bar chart. Save the fancy stuff for when bars genuinely cannot do the job.
Turn it sideways for long names
Names like "Pressure washer" or "North American Enterprise" never fit under a vertical bar without tilting into a slant nobody can read. Switch the orientation to horizontal in the Style tab and the names sit on the left, one tidy line each. Horizontal bars are also the natural shape for a ranking, because people read from top to bottom.
One quirk worth knowing: in a horizontal bar chart the first row of your data is drawn at the bottom. To put the biggest bar on top, as the tool library does, list your rows from smallest to largest. ChartCreate never re-sorts your data behind your back, so the order you give it is the order you get.
Stack it to show what each bar is made of
When every bar splits into parts, switch on Stacked and each bar shows its total and its make-up at once. The shelter chart below counts adoptions per month, with cats and dogs as the two segments. The total grows from 42 in January to 79 in June, and the segments show where the growth came from. Dogs barely move, from 24 to 33. Cats go from 18 to 46 as spring fills the shelter with kittens.
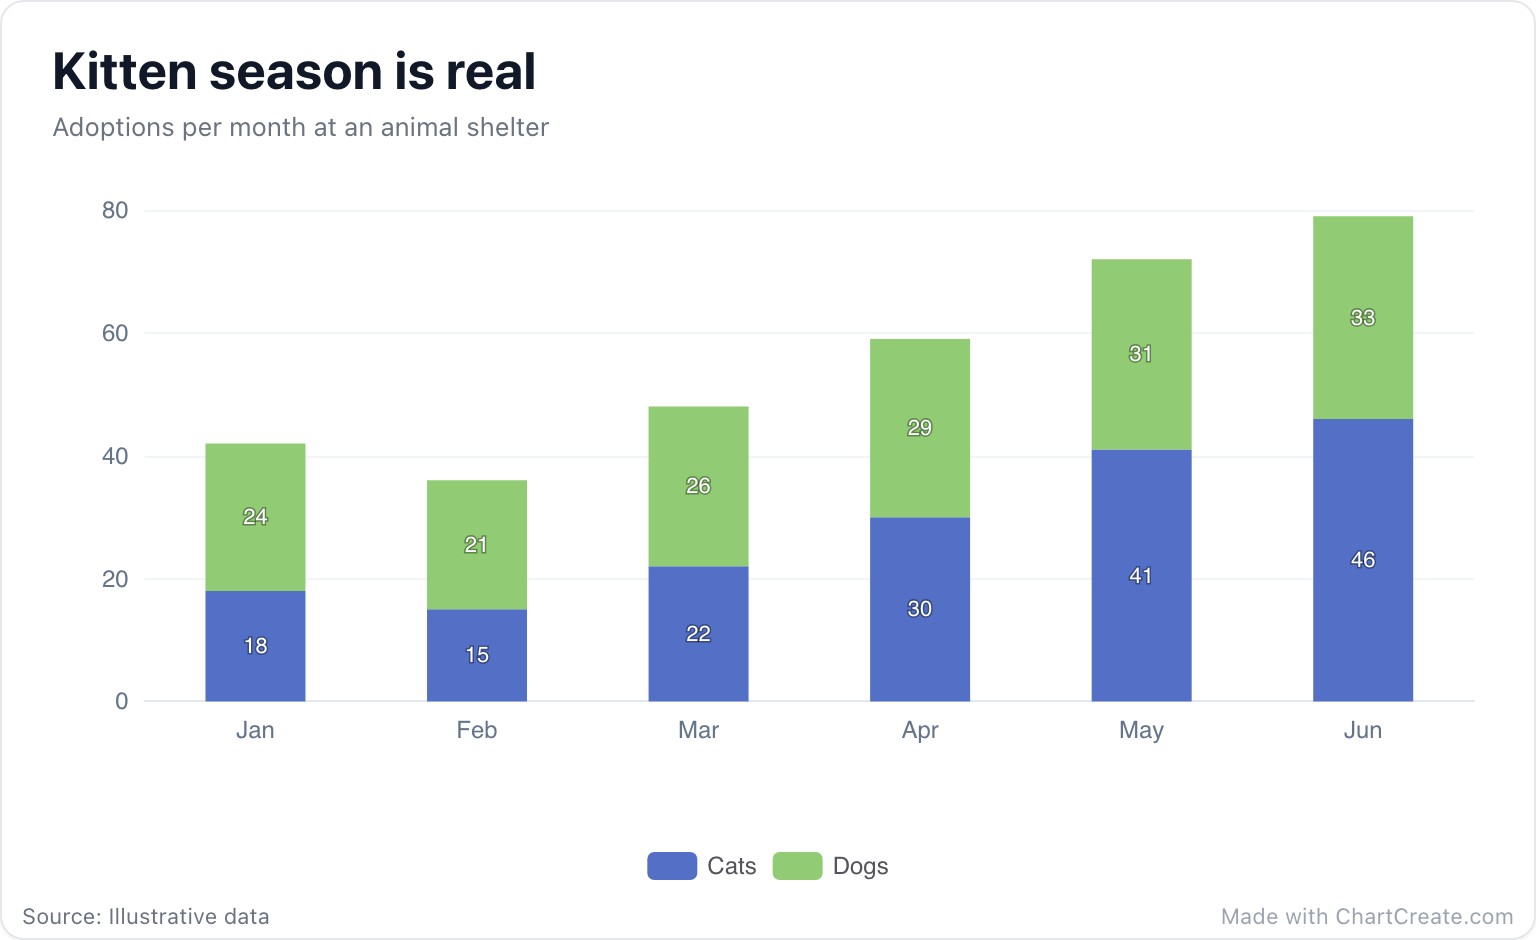
Keep stacks to two to four segments, and put the one you care about most at the bottom (the first column after the labels), since it is the only segment that starts from a flat line. With stacking on, the value labels move inside each segment so they never sit on top of the next one.
Finishing touches
Paste your table from Excel or Google Sheets, or import a CSV or XLSX file: the first column holds the names and each column after it becomes a set of bars. Switch the value labels on when the exact numbers matter and off when the shape is the story. Set the number format once (currency, percent, or compact numbers like 1.2K) and both the labels and the axis follow. On vertical bars, long or numerous names tilt automatically so none get dropped, and you can set your own angle in the Axis & Grid section.
If the chart is headed for a blog post rather than a board meeting, flip the render style to Sketchy or XKCD for a hand-drawn look. Then export a PNG for slides, an SVG that stays sharp at any size, or a short video of the bars growing in for social media.