How to make a bar chart race people watch to the end
A bar chart race turns a ranking table into an actual race: bars grow, overtake each other and change places while a big counter ticks through time. It is the rare chart people watch to the end for fun.
Each contender is a bar, sorted with the leader at the top. Press play and the chart steps through your periods one by one. Bars grow or shrink, swap places when someone overtakes, and the current period sits in big gray type in the corner. The movement between periods is smooth, so bars slide rather than jump. It is built for the feed, where a still chart gets scrolled past and a race gets watched.
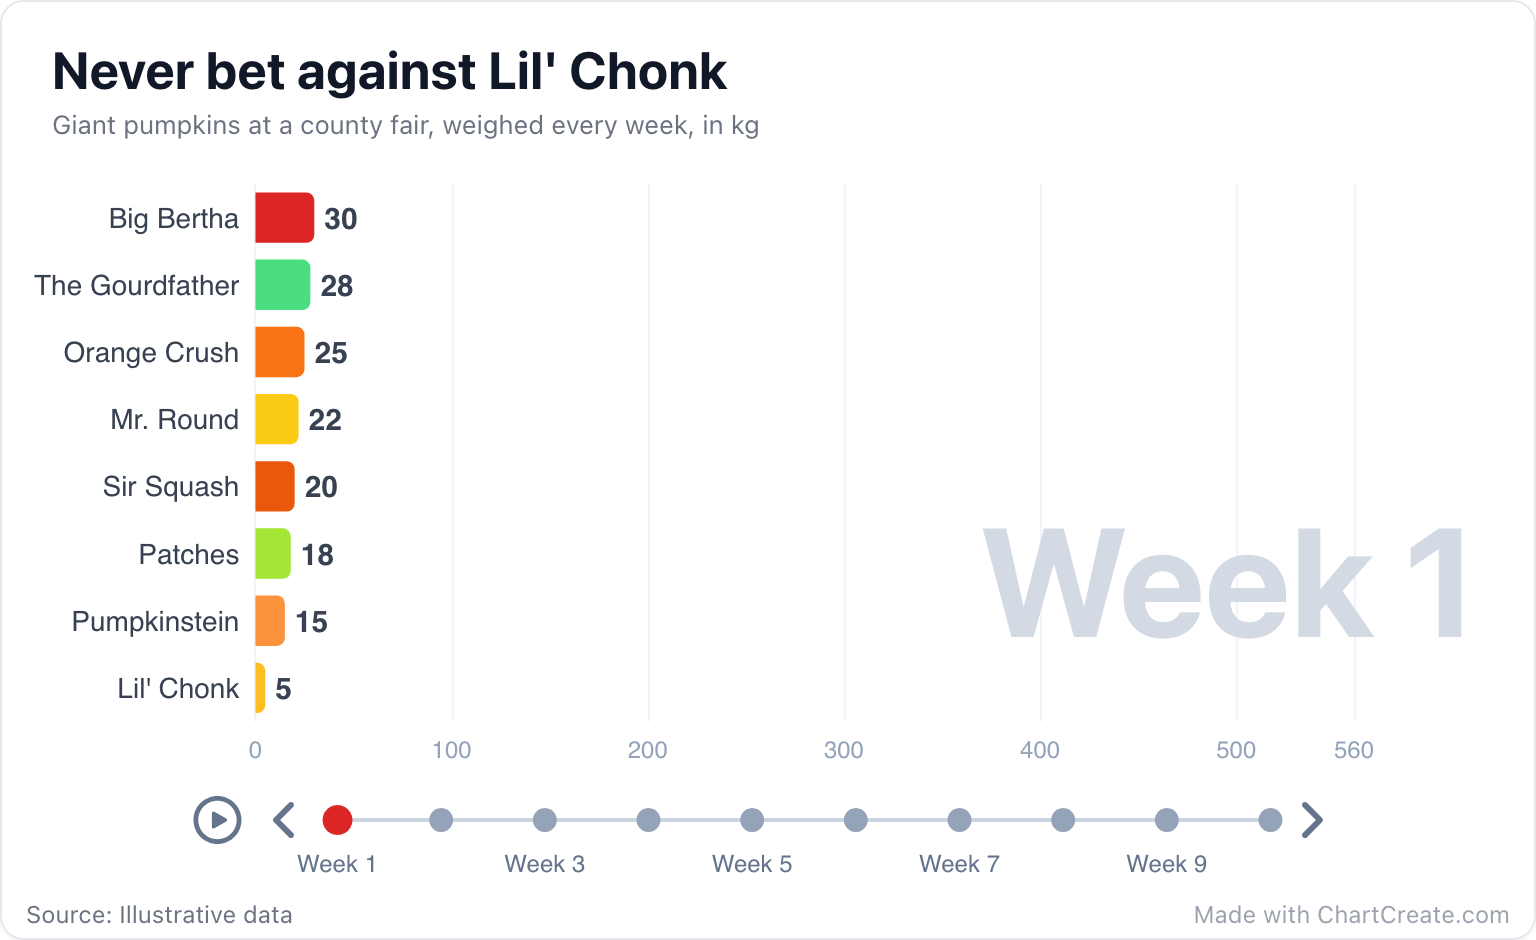
Why the pumpkin race works
Every good race has a plot, and this one has three acts. Big Bertha leads from week 1 to week 6, then stalls and finishes at 308 kg. Sir Squash takes over in week 7, and Pumpkinstein leads in weeks 8 and 9. Meanwhile Lil' Chonk, dead last at 5 kg in week 1, quietly grows faster than everyone else and wins the final week with 560 kg.
That is the formula: an early favorite, a few lead changes, and an underdog nobody saw coming. Data with the same leader in every period makes a very boring race, however nicely it animates.
A bar race is a story with a scoreboard. If nobody overtakes anybody, there is no story.
When to race, and when to sit still
Use a bar race for rankings that change over time and have a story worth telling: the most-streamed artists by year, a sales leaderboard by month, an office step challenge week by week, your fantasy league standings. It is made for video, social posts and talks where you control the pace.
It is the wrong chart for careful analysis. Nobody can compare week 4 with week 9 while the bars fly past, and a bar race printed on paper is just a bar chart. If readers need to study the whole history, show a line chart, or a bump chart if only the ranking matters.
Making one in ChartCreate
Contenders are rows and periods are columns. The first column holds the names, and every number column after it is one period, titled with what the big counter should show, such as 2024 or Week 3. The + Row button adds a contender, + Series adds a period, and you can rename any column header. Once the columns are in place, paste the table from a spreadsheet or import a CSV or XLSX file.
Race Options in the Style tab does the rest. Set the seconds per period, from half a second to three. Choose how many bars are on screen, from the top 3 to the top 20. Pick the axis: Follow the leader rescales so the front-runner always fills the width, while Fixed keeps one scale for the whole race so you can watch everything grow, which is what the pumpkins use. Each contender can have its own color and a logo that rides the tip of its bar, and each period can have a caption under the big counter, perfect for "Week 7: Big Bertha stalls".
Exporting for the feed
The Download menu exports the whole race as a video or an animated GIF. The video is an MP4, or a WebM in browsers that can't record MP4. Under Video & GIF Export you can hold the final frame for up to six seconds so viewers can read the result. The total length is the seconds per period times the number of periods, plus that hold.
Choose the Reels/TikTok size for vertical video or the Instagram square, and the text scales up to stay readable on a phone. You can also save a PNG or JPG of the period on screen. There is no SVG export for races. Every export carries a small "Made with ChartCreate.com" credit, and that is the whole price: ChartCreate is free, with no account to create.