How to make a doughnut chart that gets to the point
A doughnut chart is a pie chart that went to design school: same idea, a hole in the middle, a little more poise. It shows how one whole splits into a few parts.
Each slice of the ring is one part, and its length around the ring is its share of the total. With the middle gone you judge the arcs rather than the angles at the center, and people read them about as well as pie slices. What the hole really buys you is calm. A ring looks lighter than a solid disc, and it sits comfortably next to text on a dashboard, a slide or a report.
What the meeting example shows
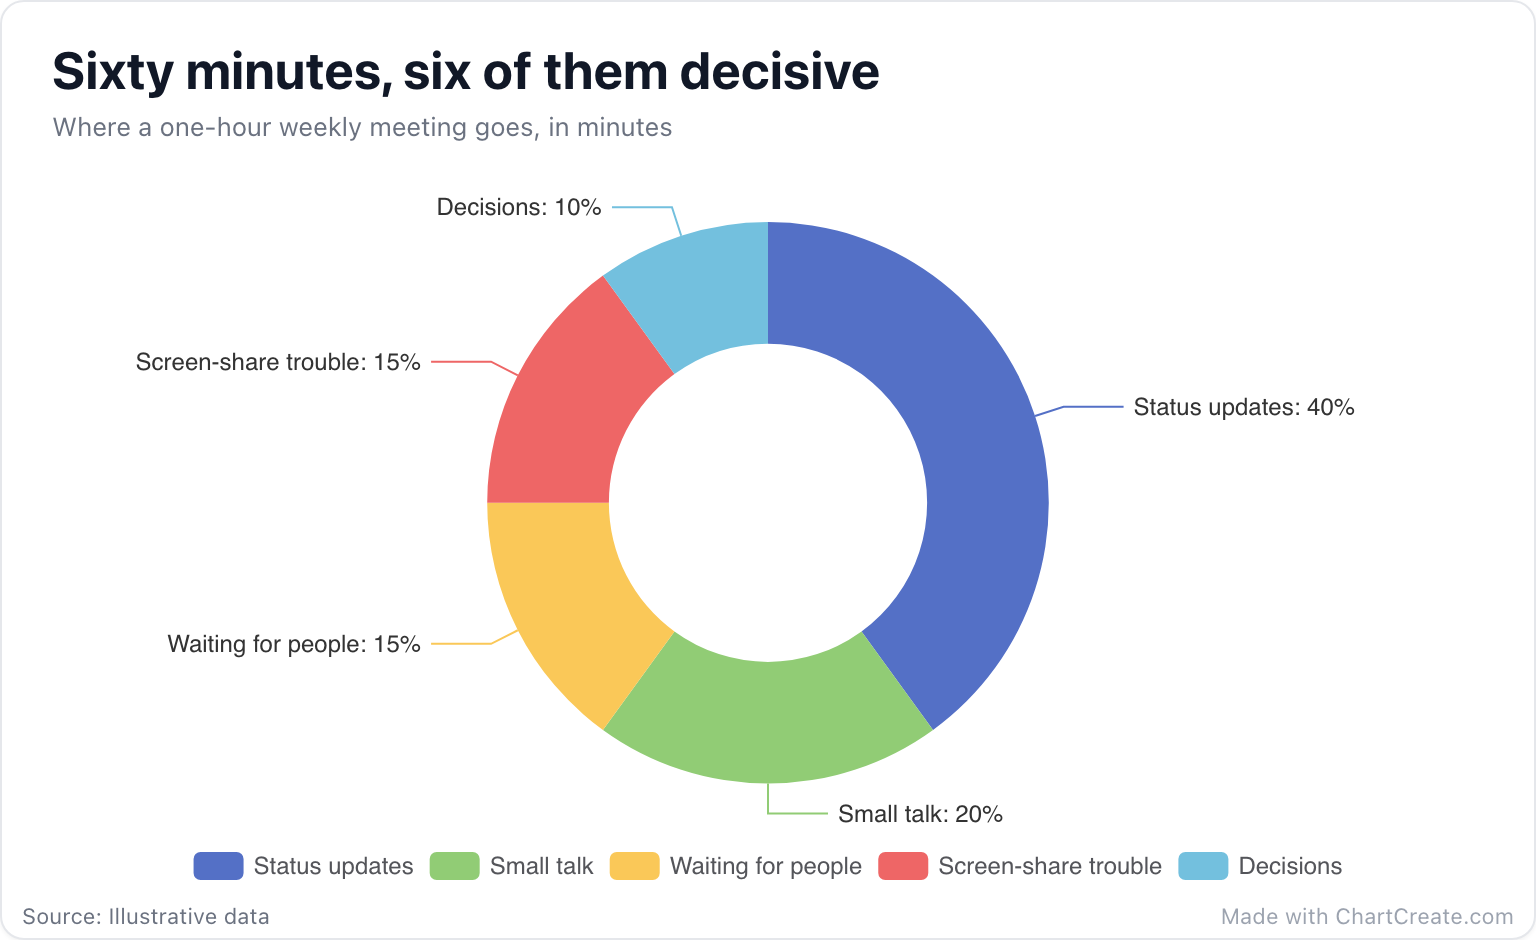
The numbers going in are minutes, not percentages: 24, 12, 9, 9 and 6, which add up to the hour. ChartCreate works out each share and prints it on the label, so the ring says at once what the minutes column would make you calculate. Status updates eat 40% of the meeting. The part where anything actually gets decided is the thinnest slice, at 10%.
Five slices is about the limit. The two 15% slices sit side by side and would already be hard to tell apart by size alone, which is why the labels carry the percentages. Notice the order, too: the rows run from largest to smallest, so the slices step down clockwise from the top and the eye knows where to start.
A doughnut is for a point you can make in one sentence. If you need a second sentence, you need a bar chart.
The progress ring
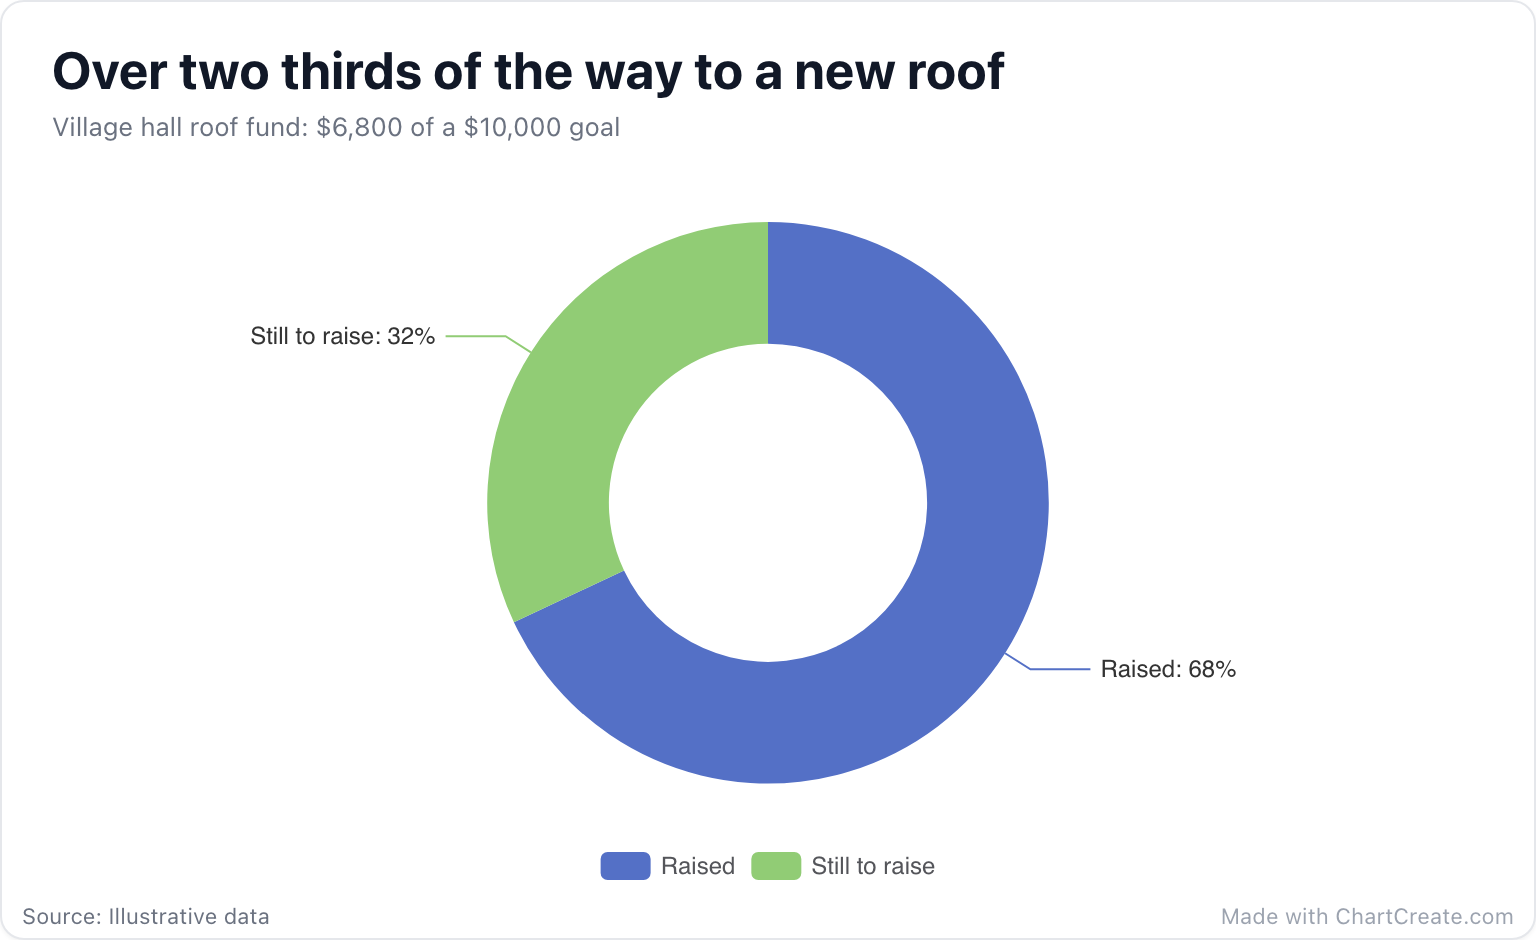
With just two slices, a doughnut becomes a progress meter: done and not done. The village hall below has raised $6,800 of a $10,000 roof fund, so 68% of the ring is filled. It reads instantly, it survives being shrunk to a thumbnail, and nobody needs an axis to understand it. For a single number against a target with a needle and a scale, the gauge chart is the other option.
When a doughnut is the wrong chart
Doughnuts share every limit of the pie. They are for parts of one whole, so never use one for values that do not add up to anything, like the average rating of five products. They get unreadable past five or six slices. And they are poor at comparison: put two doughnuts side by side and readers will struggle to see that a slice grew from 22% to 26%. To compare many categories, or the same categories across years, use a bar chart, stacked if you need the parts.
Making it in ChartCreate
Two columns are all it takes: a name and a value. Type them in, paste them from Excel or Google Sheets, or import a CSV or XLSX file. In the Style tab, choose whether the slice labels sit outside with leader lines, inside the ring as bare percentages, or nowhere at all. Outside suits longer names, as in both examples here. Inside works for a ring with a few big slices.
Pick one of the fourteen palettes with clearly different neighboring colors, write a title that states the point rather than the topic, and check your numbers before you export. Negative values have no place in a doughnut, and ChartCreate draws them by their size, so a slice that looks too big may be a minus sign in disguise. When it is right, export a PNG, an SVG, or a short video of the ring drawing itself in.