How to make a box plot that compares spread, not just averages
A box plot squeezes a whole distribution into one small drawing: the typical value, the spread and the extremes. Put a few side by side and you see not only which group is higher, but which one you can count on.
It is also called a box-and-whisker plot, and the statistician John Tukey made it popular in the 1970s. Each one is built from five numbers. The line inside the box is the median, the middle value. The box runs from the lower quartile to the upper quartile, so it holds the middle half of your data. The whiskers reach out to the minimum and the maximum. A short box means a consistent group; a long one means anything can happen.
Reading the commute
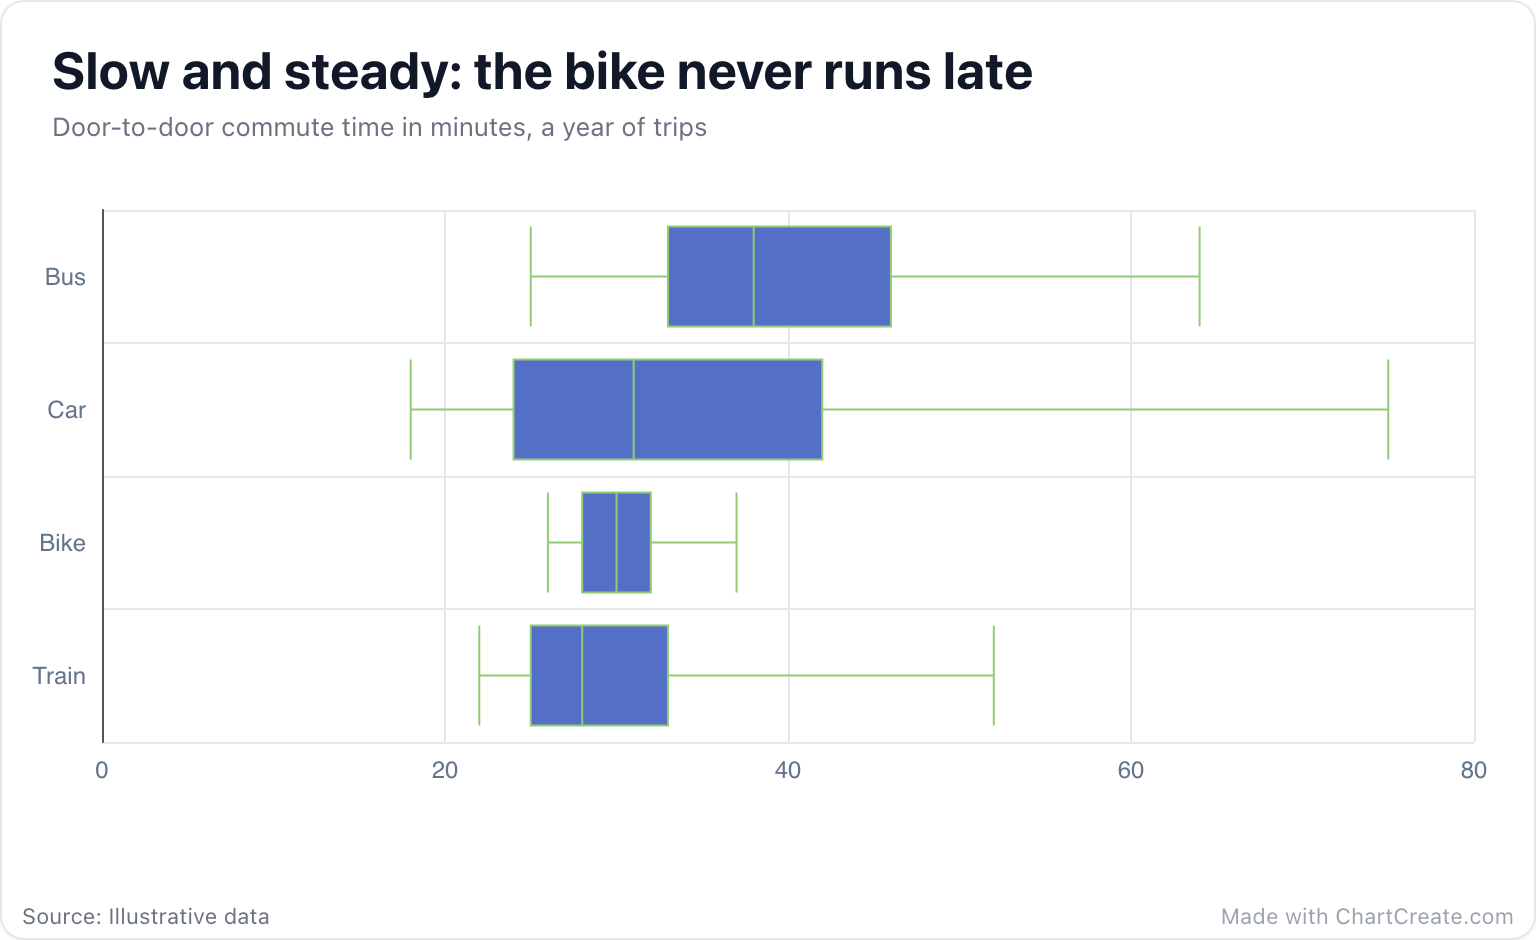
Compare the medians first. The train wins with a typical trip of 28 minutes, just ahead of the bike at 30 and the car at 31, while the bus trails at 38. If medians were the whole story, you would take the train and stop reading.
Now look at the boxes and whiskers. The car has the fastest trip of the year, 18 minutes on an empty road, and also the slowest, 75 minutes on a bad day, with a box stretching from 24 to 42. The bike’s box runs from 28 to 32 and its worst trip took 37 minutes. It is never the quickest way in, and it is never the reason you are late. Whether that beats the train depends on how much you hate surprises, which is exactly the conversation a box plot is for.
An average tells you what usually happens. A box plot tells you what can happen.
When to use one
Box plots shine when you compare the same measure across several groups: delivery times by courier, test scores by class, prices by neighborhood, response times by server. They stay compact with ten or more groups, where overlapping histograms would be a mess. For a single group, a histogram shows the shape in more detail. And for an audience that has never seen a box plot, a bar chart of medians is easier to read, though it hides the spread you wanted to show; a one-line note explaining the box usually solves that.
Making one in ChartCreate
ChartCreate draws a box plot from five numbers per group rather than from raw data: minimum, lower quartile (Q1), median, upper quartile (Q3) and maximum, with one group per row. In Excel or Google Sheets, the MIN, QUARTILE, MEDIAN and MAX functions give you all five from a column of raw values; use QUARTILE with 1 for Q1 and 3 for Q3. Then paste the summary table into the data panel or import it as a CSV or XLSX file.
The Orientation option lays the boxes out horizontally, the default and the best choice for long group names, or vertically. The boxes are filled with your palette’s first color and outlined in its second, which also draws the median line, so pick a palette where those two contrast. Grid lines, in the Axis & Grid section, help the eye judge where each box starts and ends.
Two common mistakes
The first is putting the five numbers in the wrong order, which turns a box inside out. Check that every row climbs from left to right: min, then Q1, median, Q3 and max. The second is reading the whiskers as typical. They mark the single best and worst case, so one freak trip can stretch a whisker a long way. That is real information, not an error, but say so in the subtitle if it might surprise people.