How to make a Europe map that shows ups and downs
A Europe map colors each country by your data, from Iceland to the Caucasus. It is especially good at something a table makes hard: showing which way things moved, and where.
Up, down and the middle
Most maps use a sequential scale: one color, pale for a little and dark for a lot. That is right for anything that only grows from zero, like population or sales. Some data has a meaningful middle, though. A change on last year can be positive or negative, a vote can lean either way, a temperature can sit above or below normal. That calls for a diverging scale: two colors that fade toward a pale midpoint, so growth and decline read as opposites before anyone checks the legend.
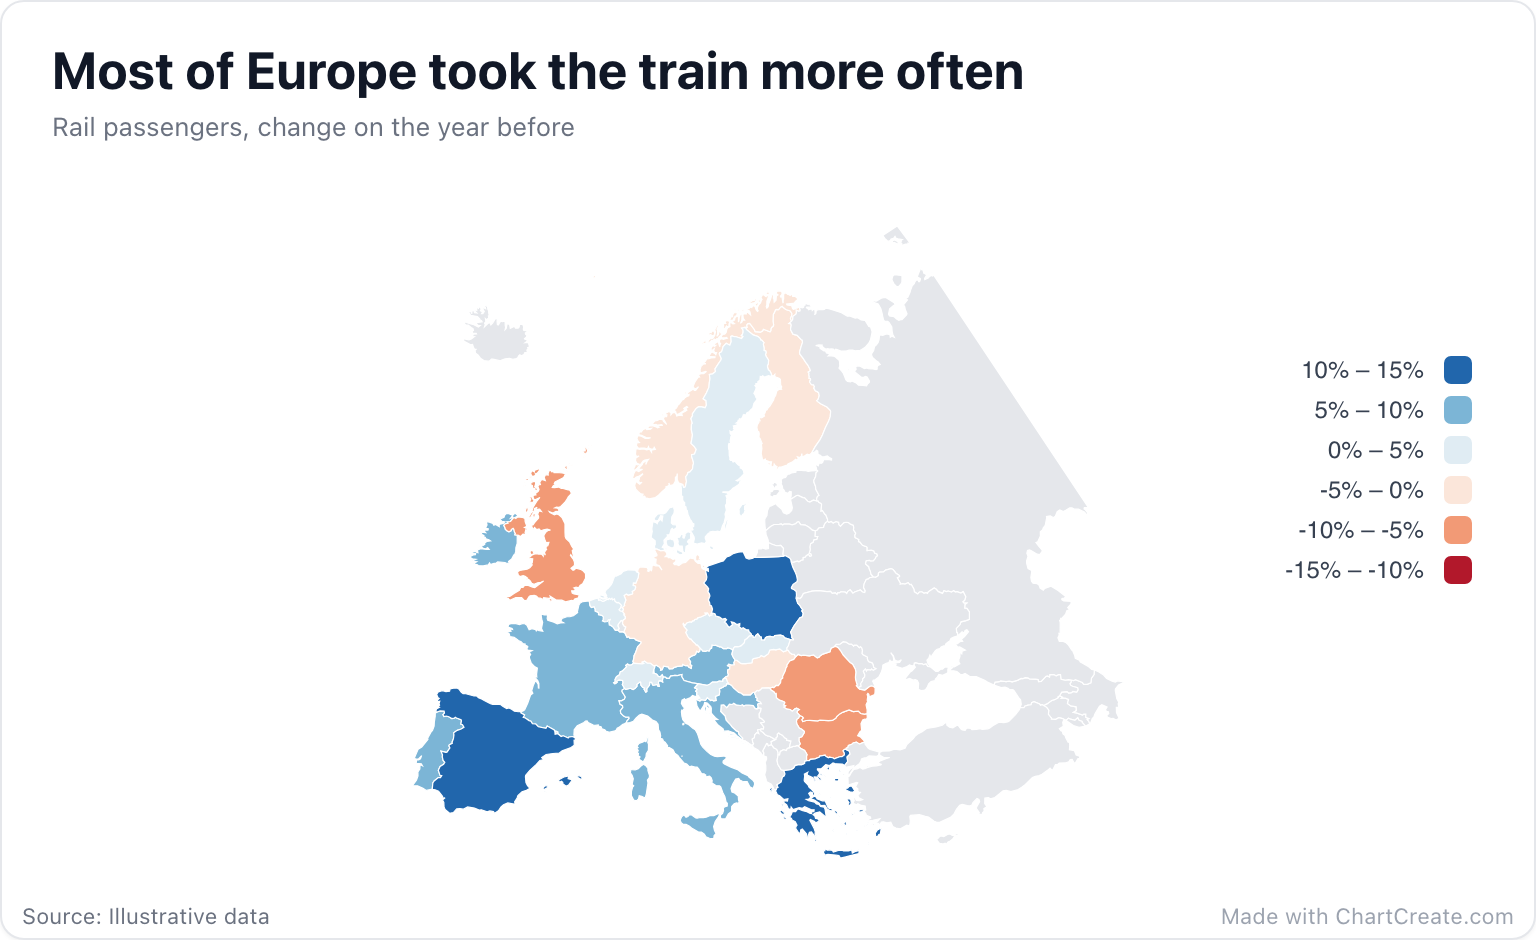
The rail map runs Red to blue with the scale fixed at -15 to 15, so zero lands exactly on the pale middle. Seventeen countries come out blue, led by Spain at 14%, and seven come out red, with Bulgaria deepest at -9%. Left on automatic, the scale would have run from -9 to 14 instead, putting the midpoint at 2.5. Belgium and Denmark, both up 2%, would then have fallen on the red side, next to the countries that lost passengers.
On a diverging scale the middle has to mean something. Put zero there on purpose.
Setting it up in ChartCreate
Paste a column of countries and a column of values, then open the Map section in the Style tab. Choose Red to blue under Color scale and type the same number, once negative and once positive, into Scale min and max. Pick an even number of steps, six in the rail map, so that zero falls on the line between two classes rather than inside one. Values beyond the bounds take the end colors, while tooltips and labels keep the real number. Number Format in the Display section adds the % sign to the legend and labels.
The default projection is Equal area, centered on Europe: the look of official European statistics maps. It keeps the north at its true size, so Scandinavia does not balloon the way it does on web maps. Malta, Luxembourg and the microstates are on the map but only a few pixels wide. If one of them matters to your story, say so in the subtitle or switch on Values on map.
Names, codes and the United Kingdom
Country names match in English, Spanish, Portuguese, French and German, so Deutschland, Allemagne and Alemania all land on Germany. Two- and three-letter ISO codes work too; the rail map uses DE, FR, ES and friends. Spelling and accents are forgiving, and any row that matches no country is highlighted in amber in the Data tab.
One European quirk to know about: England, Scotland, Wales and Northern Ireland all land on the United Kingdom, because the map draws the UK as one country. With numbers, rows that land on the same country are added together. That is right for counts and wrong for percentages, so combine the nations yourself before you paste a rate.
When a map is not the answer
If you only have a handful of countries, or the exact values matter more than the geography, a bar chart sorted from the biggest gain to the biggest loss shows the same data more precisely. A map earns its place when the pattern is geographic: neighbors moving together, a border where the colors flip, a region that went its own way.
Finish with the border and ocean colors in the Map section, then download a PNG, JPG or SVG, sized for a slide or a social post. It is free with no account, and every export carries a small "Made with ChartCreate.com" credit.