How to make a funnel chart that finds the leak
A funnel chart shows a crowd thinning out on its way through a process. Its real job is to point at the one step where most people give up.
Each stage is a bar, stacked top to bottom in the order people move through them, and each bar is as wide as the number of people who made it that far. The shape does the reading for you. A gentle taper means a healthy process; a sudden pinch means something at that step is turning people away.
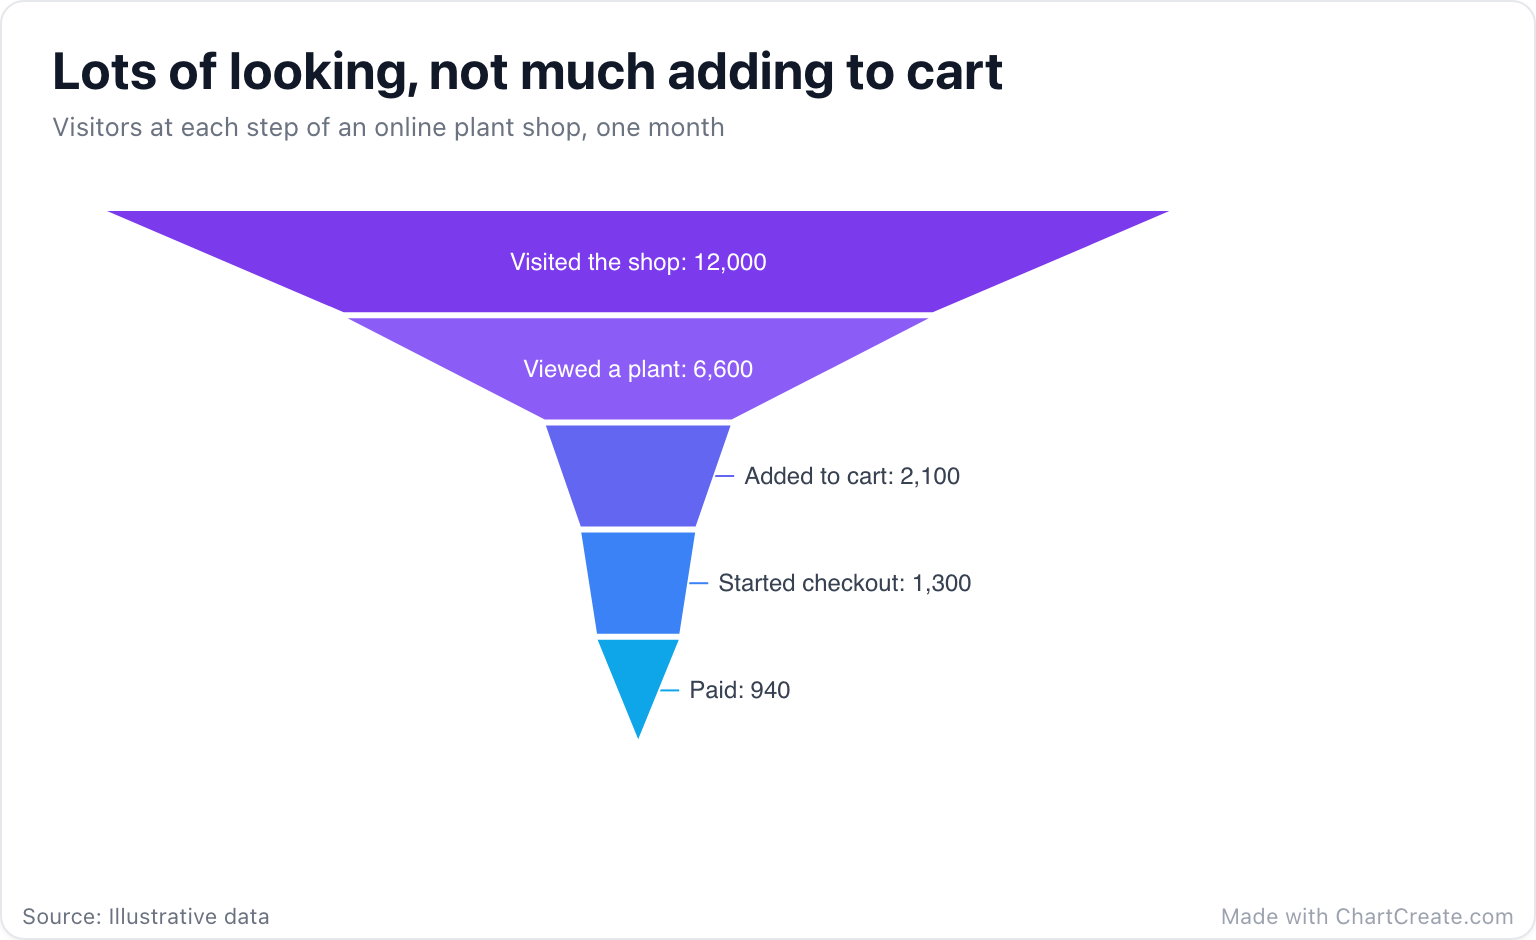
Reading the plant shop
Of 12,000 visitors, 940 paid for an order, just under 8 percent. That sounds grim until you look at where the others went. More than half the visitors looked at a plant, which is healthy. The pinch is the next step: of the 6,600 people who viewed a plant, only 2,100 put one in the cart, so about two in three walked away from the product page.
Once a plant is in the cart, people mostly follow through: 940 of the 1,300 who started checkout paid, 72 percent. So the fix belongs on the product page, with better photos, a clearer price, or a note on how much light the plant needs. Polishing the checkout would mean fixing the step that already works.
Don’t ask how many made it to the end. Ask which step lost the most, and fix that one first.
When to use one, and when not
A funnel fits any process with a fixed order where each stage is a subset of the one before: a sign-up flow, a sales pipeline, a hiring round, an online checkout. If people can skip steps, come back later, or head off in different directions, the numbers no longer nest, and a funnel draws a tidy picture of something untidy. A Sankey diagram can show where the leavers went instead, and a plain bar chart suits stages that are really just categories in a list.
Making one in ChartCreate
You need two columns: the stage and how many reached it. Type them in, paste them from a spreadsheet, or import a CSV or XLSX file. Every bar’s width is proportional to its value, so a stage with half the people is exactly half as wide, which keeps the shape honest. By default the stages are sorted from largest to smallest. Set Sort Direction to Data Order to keep your own order, or to Ascending to flip the funnel into a pyramid.
Each label shows the stage name and its count, inside the bar, or just outside it when the bar is too narrow to hold the text. The labels don’t work out conversion rates, so do that division yourself and put the number that matters in the title or subtitle, where nobody can miss it. Each stage takes the next color in your palette.
Two common slips
The first is mixing time periods. This week’s visitors next to last month’s orders makes a funnel that lies, so take every stage from the same group of people over the same dates. The second is a stage that is bigger than the one before it, which usually means two different things were counted. With sorting on, ChartCreate will quietly move that bar up into size order, so check that the labels still read in the order your process actually runs.