How to make a gauge chart for the one number that matters
A gauge chart puts a single number on a dial, so anyone can tell at a glance how close it is to the goal. It shows less than any other chart here, and that is exactly why it works.
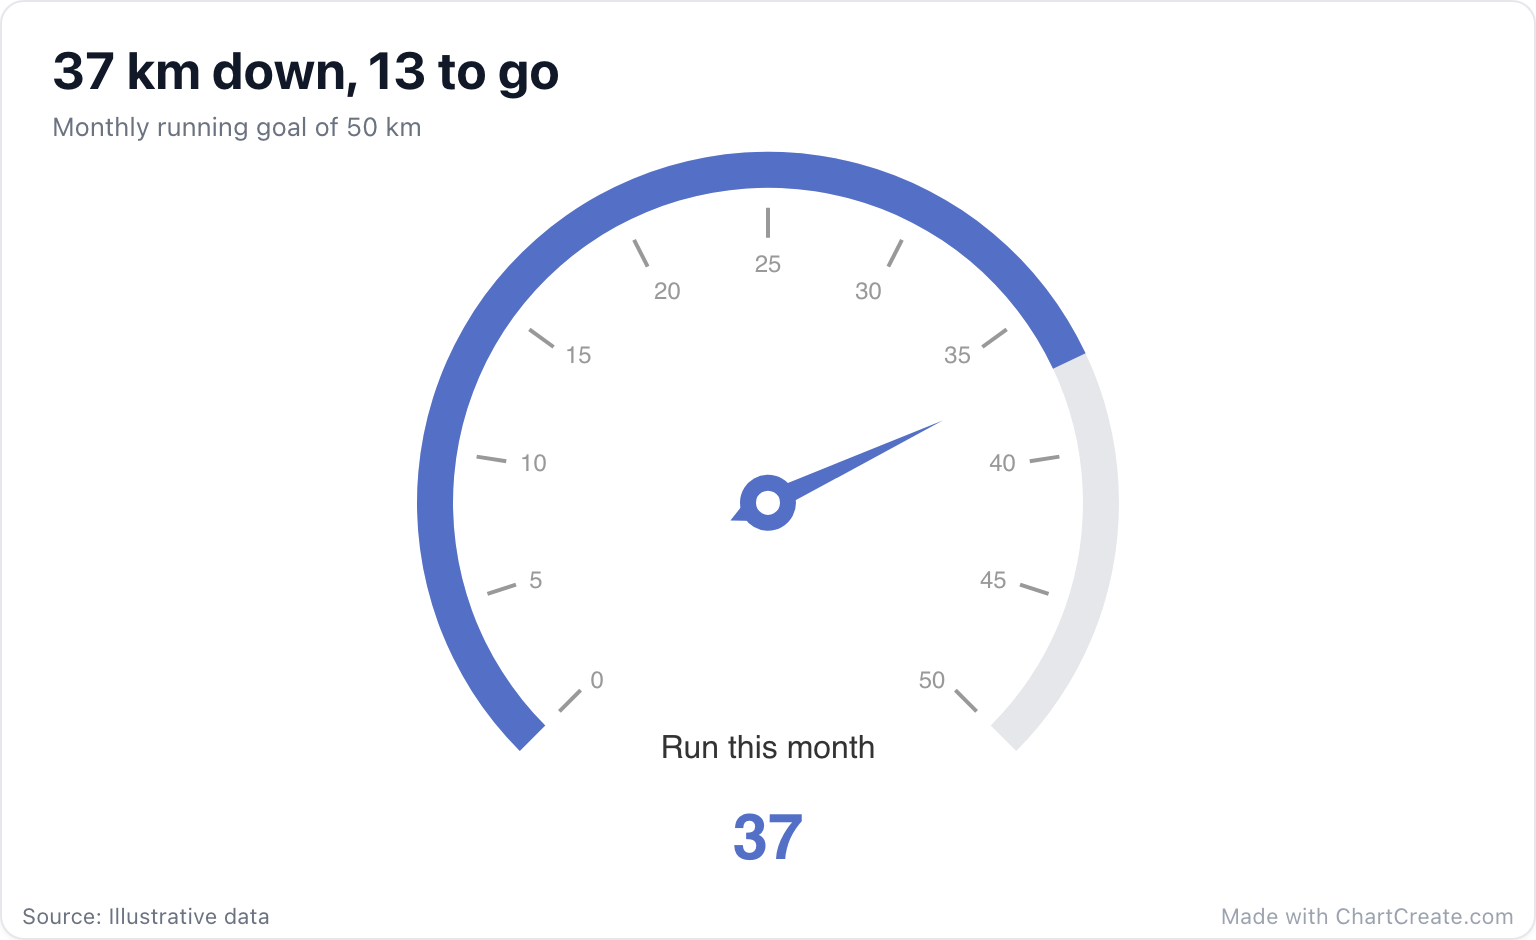
Think of it as a speedometer for one metric. The arc runs from a minimum to a maximum, a needle points at the current value, and the filled part of the arc shows how much of the range is covered. Under the needle sit the metric’s name and the number itself in large type, so nobody has to estimate anything from an angle.
When a gauge earns its place
Use a gauge when there is one number, one range and one question: are we there yet? Progress toward a fundraising target, a monthly goal, seats filled in a venue, a satisfaction score out of 100. It works well at the top of a dashboard or alone on a slide, where it sets the mood before the details arrive.
It works badly the moment you want to compare. Five gauges in a row make the reader turn five dials in their head, while a bar chart shows the same five numbers in a single sweep of the eye. A gauge also says nothing about how you got here. If the trend is the story, use a line chart.
One gauge is a headline. Five gauges are a cockpit, and nobody reads a cockpit for fun.
Set the range first
The range is the biggest decision on a gauge, because it decides what the needle means. A runner who has done 37 km of a 50 km goal is nearly there. Put the same 37 on a dial that runs to 200 and it looks like a lost month. Match the range to the real question: zero to the target for progress, zero to 100 for a score, zero to the limit for capacity. Round maximums like 50 or 100 also give you clean numbers around the dial.
Making one in ChartCreate
Type a name and a value into the first row of the data panel; the gauge shows that first row only. Then set Min and Max with the sliders in the Style tab. They won’t let the range shut out your value, so the needle always stays on the dial, and the minimum can go below zero for things like temperatures. The sliders run from -1,000 to 1,000, so for bigger numbers show a percentage instead: $6,850 raised toward $10,000 becomes 68.5 out of 100.
The filled arc, the needle and the big number all take the first color of your palette, on a neutral gray track. Choose a palette whose first color suits the news, or pick your own from any color swatch: green for on track, red for a warning. Then write a title that says what the number means, because the dial can’t.
The classic mistake
The most common gauge mistake is decoration: red, amber and green bands painted around the whole dial, so the chart looks alarming wherever the needle points. ChartCreate keeps the track plain and fills only the distance covered, which is calmer and easier to read. Let the color and the title carry the verdict, and keep the dial for the number.