How to make a network graph that shows who is connected
A network graph draws things as dots and their relationships as lines, then lets the whole picture settle into shape. Clusters, loners and the go-betweens all show up on their own.
The dots are called nodes and the lines are called links, or edges if you are talking to a mathematician. ChartCreate uses a force-directed layout: linked nodes pull toward each other, all nodes push each other apart, and the picture settles where those forces balance. Tightly connected groups end up huddled together. A node that connects two groups ends up between them, and that is usually the most interesting node on the page.
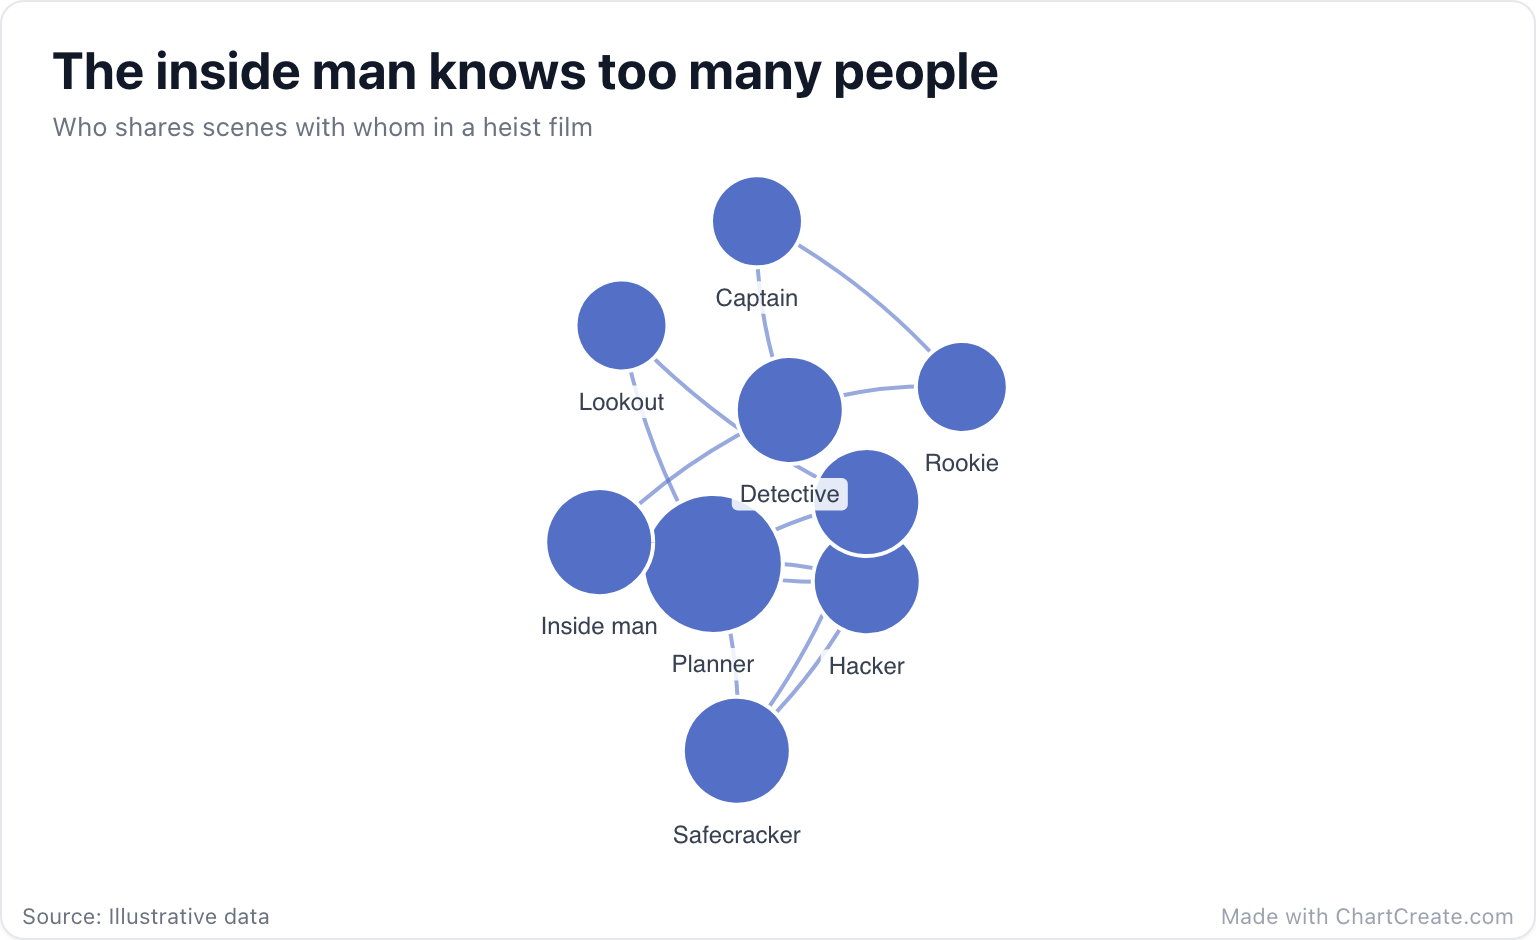
Reading the heist example
Nine characters, thirteen links. The Planner is the biggest node because it has the most connections, five of them: the Hacker, the Driver, the Safecracker, the Inside man and the Lookout. The crew forms one tight knot. The police form another, with the Detective, the Captain and the Rookie all linked to each other.
Exactly one line crosses between the two groups, from the Inside man to the Detective. You don't need to watch the film to guess how it ends. The chart has already told you who is talking to whom.
When a network graph is the right call
Use it when the connections themselves are the story: who emails whom, which pages link to which, which software packages depend on which, which characters share scenes. It is the best tool there is for spotting communities, hubs and bridges. It is not a precision instrument, though. Positions on the page carry no units, and up and down mean nothing, so describe what is connected, not where it happens to sit.
If your links have a direction and an amount that flows through them, like money moving between accounts, a sankey diagram shows the amounts far better. If you have a handful of groups and want to show how strongly each pair is linked, try a chord diagram.
The most important node is rarely the biggest. Look for the one holding two clusters together.
Making one in ChartCreate
Each row is one link: a source, a target and a value. New names become new nodes automatically, and clicking a node in the editor's node list renames it in every link at once, which saves a lot of find and replace. You can paste the three columns from a spreadsheet or import a CSV or XLSX file. The editor flags any row it can't draw, such as a link from a node to itself or a value of zero or less.
Node size follows the number of connections, so hubs stand out without any extra work. The value travels with each link and appears when you hover over it, which makes it a good home for counts like scenes, emails or calls. In the preview you can drag nodes around and zoom in to inspect a busy corner.
Common mistakes
Too many nodes is the classic one. Past about fifty, labels that would overlap start to disappear, and the picture turns into a hairball. Filter down to the nodes that matter, or merge the small ones into a group.
The other is spelling. To ChartCreate, "Inside man" and "Inside Man" are two different nodes, and the chart will happily show you a mysterious twin with one lonely link. Keep names consistent, and use the node list to rename rather than retyping.