How to make a heatmap that shows you where to look
A heatmap turns a wall of numbers into a picture you can read with your eyes half closed.
Lay your data out in a grid, color each cell by its value, and the patterns surface on their own: the busy hours, the dead weekends, the one product that runs hot all week. It is a spreadsheet that finally learned to point at the interesting bits.
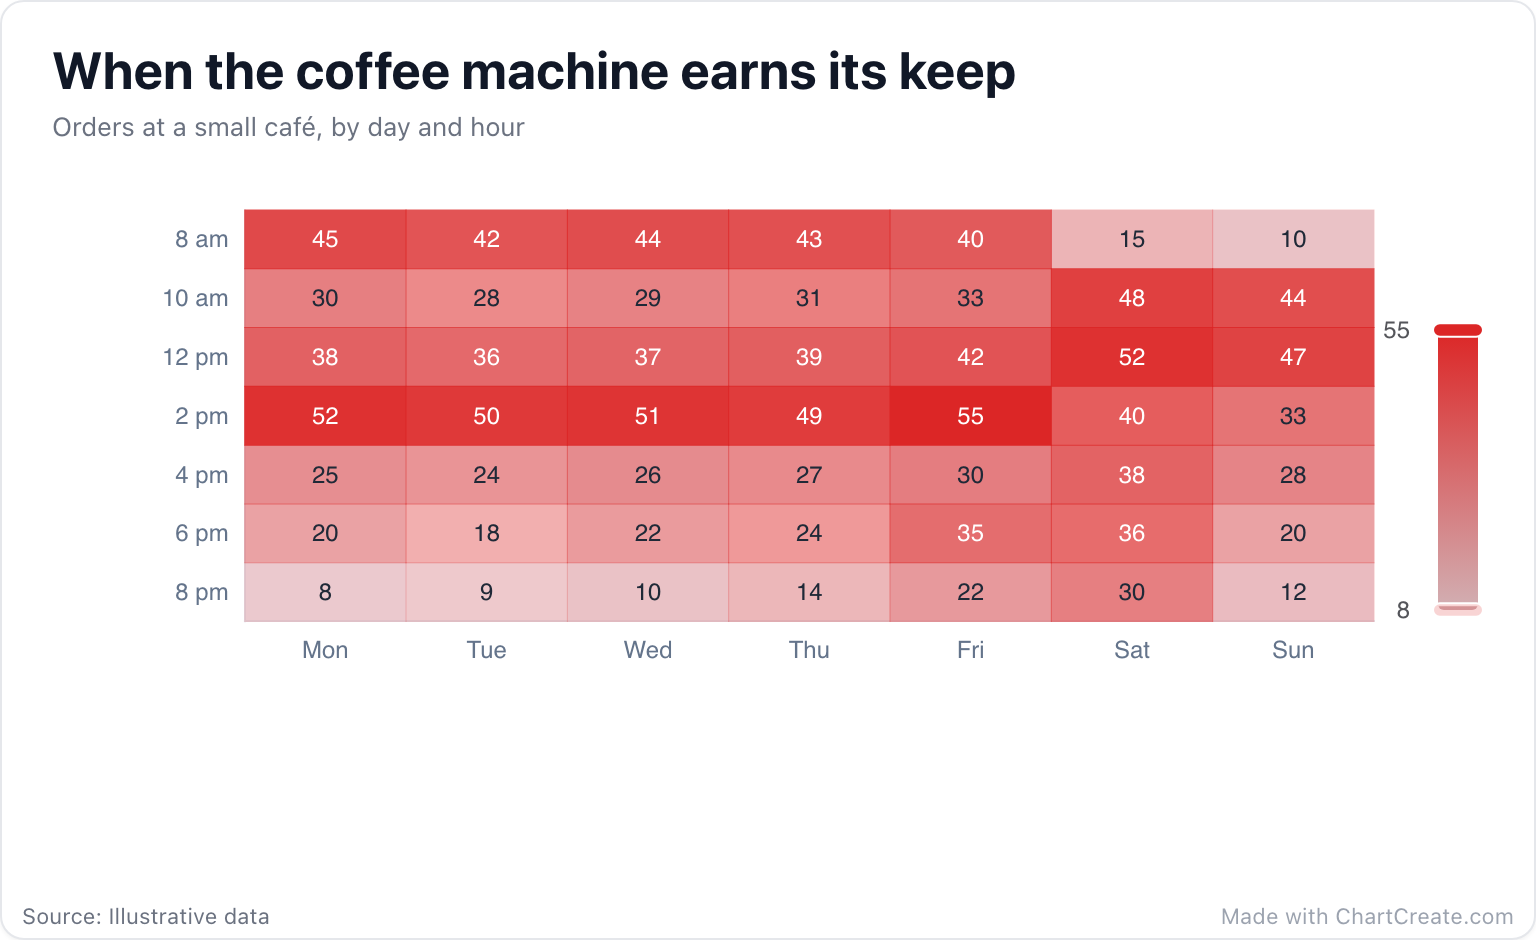
What the café example shows
Read it as a table and it is forty-nine numbers. Read it as a heatmap and three stories jump out before you have finished your own coffee: the weekday morning rush, an even bigger wave at 2 pm when the post-lunch slump hits, and a weekend that sleeps in and turns up for brunch. That is the whole trick. The eye reads the overall texture first, and only then the individual cells.
When it shines
Use a heatmap for anything with two categories and one value: hour of day against day of week, region against product, survey question against answer. The denser the grid, the better it works, as long as each row and column has a clear order. Shuffle the days of the week and the patterns dissolve into confetti.
If you need the exact number, use a table. If you need to know where to look, use a heatmap.
One color, light to dark
A heatmap should shade from pale to strong in a single color, so that darker always means more. Rainbow scales look exciting and lie quietly, because the eye sees borders between colors that are not in the data. ChartCreate does the honest thing for you: every cell is a shade of your palette’s first color, and every cell prints its number, in white or dark text depending on the shade behind it, so the pattern and the exact value sit side by side.
Make it yours
Give it three columns: one category for the columns, one for the rows, and the value. Paste them from a spreadsheet, pick a palette whose first color suits the subject (the café above runs warm), and export a PNG when the hot spots are obvious.