How to make a parallel coordinates chart you can actually read
A parallel coordinates chart compares many things across many measures at once. It looks like a plate of spaghetti until you learn to read it, and then it becomes one of the most honest charts there is.
Each measure gets its own vertical axis, and the axes stand side by side. Each item is a line that threads across all of them, touching every axis at its value. So one line is one item's whole profile: low here, high there, middling at the end. Lines that travel together belong to similar items. Lines that cross between two axes reveal a trade-off: what is high on one is low on the next.
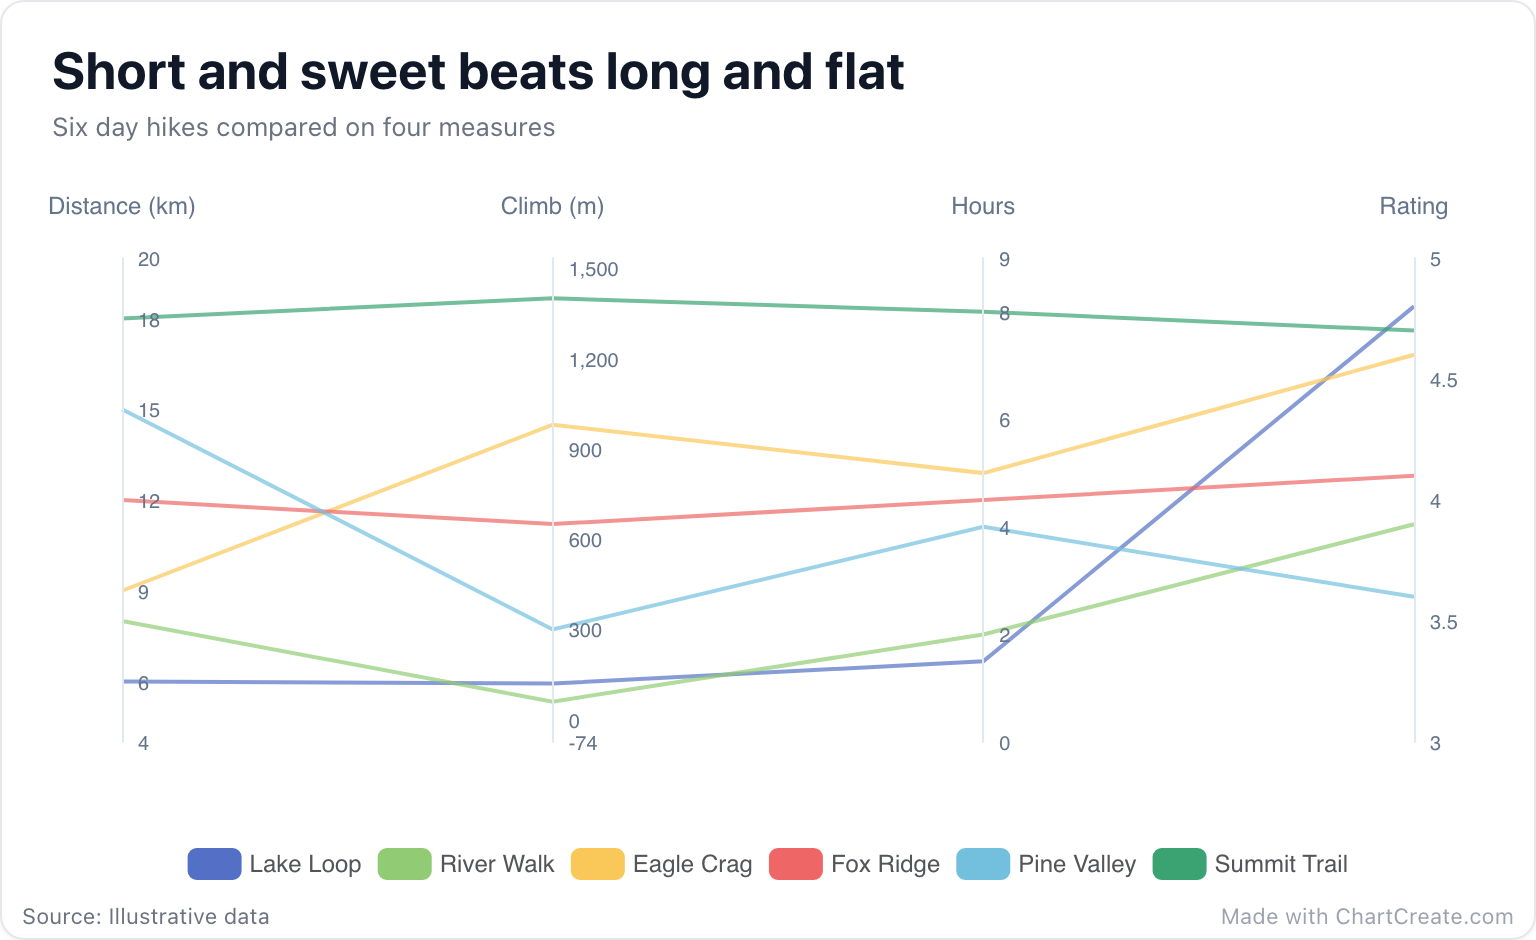
Reading the hiking example
Follow Summit Trail first. It rides high across the board: 18 km, 1,400 m of climbing, 8 hours, and a 4.7 rating. Hard work, big reward. Now follow Lake Loop. It hugs the bottom of the first three axes, with 6 km, 120 m and an hour and a half, then shoots up to 4.8, the best rating of the six.
Pine Valley does the opposite of what you would hope: a long 15 km walk with only 300 m of climbing, and the lowest rating at 3.6. The lesson is not that hard hikes are good or that easy hikes are good. It is that distance alone doesn't buy you a view. A table holds the same 24 numbers, but you would have to read every one to find that out.
When it is the right chart
Use parallel coordinates when every item has three or more numbers and you want to see profiles, clusters and trade-offs: laptops compared on price, weight, battery life and benchmark score; cities on rent, sunshine and commute time; job candidates on several interview scores. Somewhere between five and fifteen lines is the sweet spot. Many more and the lines blur into a fog.
With only two measures, a scatter plot is clearer. And if you want each of a few items to have a recognizable shape, a radar chart wraps the axes into a circle and turns every profile into a polygon.
Every axis has its own scale. Compare along an axis, never across.
Making one in ChartCreate
Put the item names in the first column and one number column per measure after it. Each row becomes a line and each column becomes an axis, in the order of your columns. The + Series button adds another measure. Once the columns are set up, paste the whole table from a spreadsheet or import a CSV or XLSX file.
Every axis is scaled to its own data, with a little padding at each end, so a column measured in meters doesn't flatten one measured in hours. Each line gets its own color from the palette, and the legend names them. Hover over a line in the preview and it thickens and comes forward, with all of its values listed in one tooltip.
Make it easier to read
Column order changes everything. Crossing lines only show a trade-off between neighboring axes, so put the measures you want to compare next to each other. Put the one that matters most, here the rating, at the end, where the eye finishes. Keep the units in the column titles, as in Climb (m), because each axis has its own scale and a bare number means little.
And don't feed it twenty items in twenty colors. Pick the five or six that matter to your point, and let a table carry the rest.