How to make a polar bar chart that earns its curves
A polar bar chart wraps a bar chart around a circle. You give up a little precision and gain a lot of presence, which is a fair trade on a poster and a bad one in a spreadsheet.
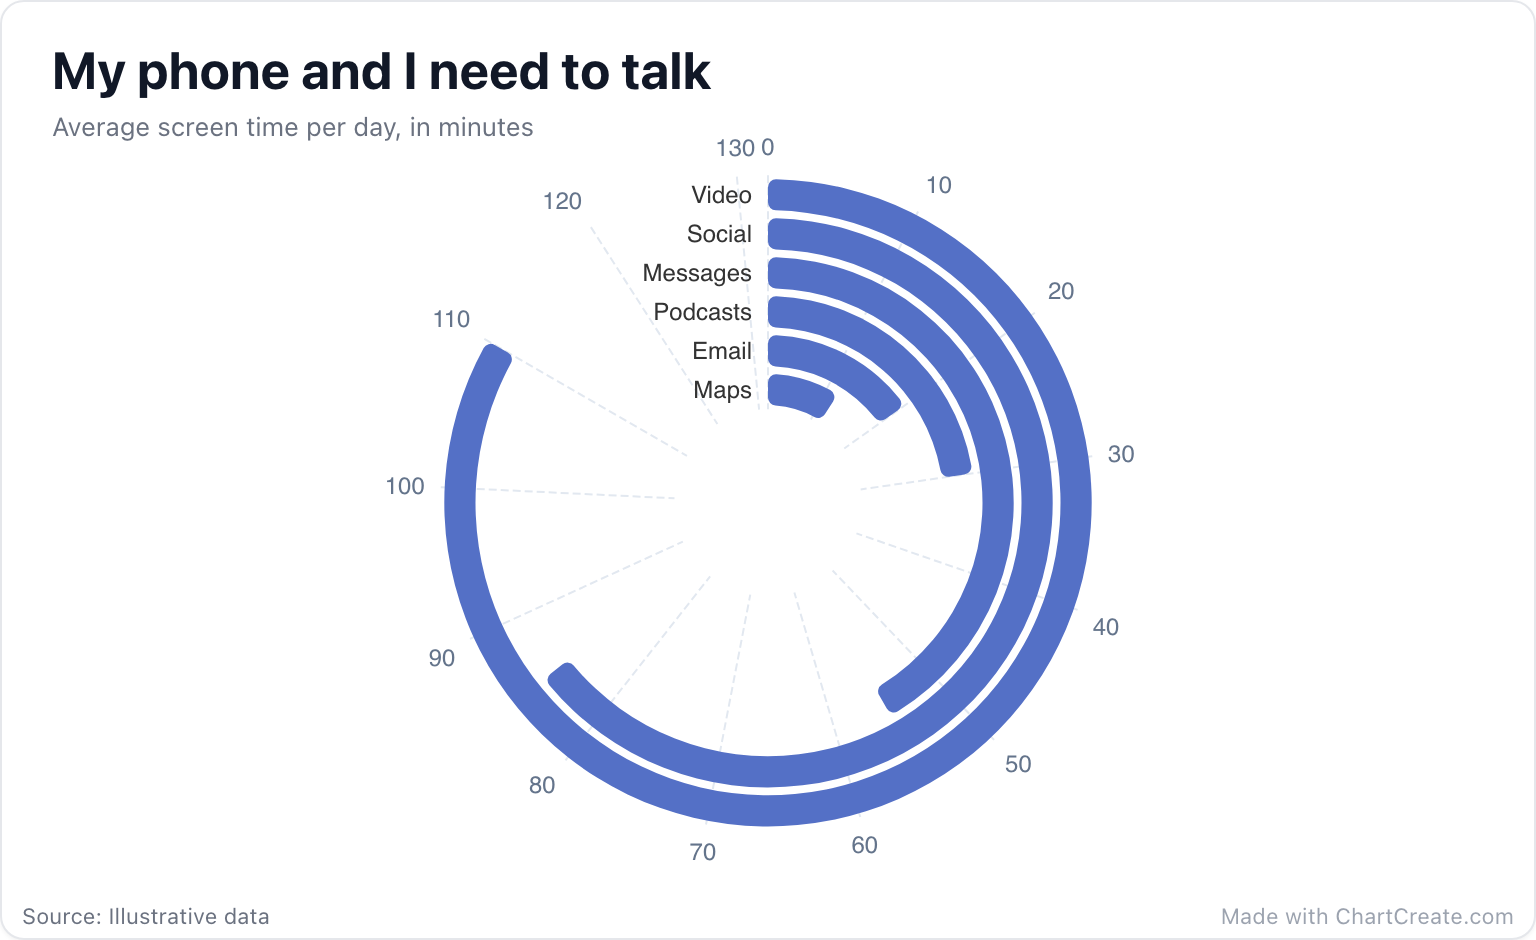
In a polar bar chart, sometimes called a radial bar chart, each category gets its own ring and its value is an arc that sweeps clockwise from twelve o'clock. The further the arc travels, the bigger the value. The first row of your data is the innermost ring and the last row is the outermost, and the numbers around the edge show how far each arc has gone. Hover over an arc to see its exact value.
Reading the screen time example
Start from the outside, where the big numbers live. Video sweeps around for 110 minutes a day, Social follows at 85 and Messages at 55. Further in, Podcasts, Email and Maps have barely left the starting line, at 30, 20 and 12. Add them all up and it comes to 312 minutes, a little over five hours a day. That is a conversation worth having with your phone.
Notice that the shape tells the story before you read a single label: a spiral that widens as it grows outward. That is what sorted data looks like on a polar bar, and it is the main reason to sort.
When round beats straight
Use a polar bar when you have a handful of categories, roughly three to eight, and the job is to catch the eye: a social post, a dashboard tile, the cover of a report. It suits rankings, where the order matters more than the exact gaps.
When precision matters, use an ordinary bar chart. Our eyes compare straight bars from a shared baseline very well and curved arcs much less so. There is also a built-in bias: an outer ring is longer than an inner one, so the same value looks bigger on the outside. Sorting tames it. With the smallest value in the middle and the biggest on the outside, the distortion runs in the same direction as the data instead of against it. And with twenty categories the rings get thin and the labels crowd, so a bar chart wins again.
Round charts are for remembering. Straight charts are for comparing.
Making one in ChartCreate
Put the categories in the first column and the values in the second, in the order you want the rings, innermost first. Type them in, paste them from a spreadsheet, or import a CSV or XLSX file. In the chart options, the Inner Radius slider sets the size of the hole in the middle, from 0 to 70 percent. A small hole gives the inner rings more room; a large one makes a slim, modern dial.
Add a second value column and the arcs stack inside each ring, each series in its own palette color, with a legend to tell them apart. Two series read well, such as weekdays and weekends. Five look like a candy wrapper. ChartCreate scales the dial to the longest ring with room to spare, so the biggest arc stops at about 300 degrees instead of lapping itself.
Two mistakes to avoid
Unsorted rings are the big one. In random order the arcs zigzag in and out, and the chart looks like a broken spring rather than a ranking. Sort your rows by value before you paste them.
The second is long category names. The labels sit at the start of each ring, and long ones are cut short. Keep them to a word or two, and put the details, like the unit and the time period, in the subtitle.