How to make a rose chart that shows the seasons at a glance
A rose chart arranges your categories in a circle and lets the big ones grow outward like petals. Give it a cycle, like the months of a year, and the busy season jumps out before you read a single label.
It is also called a Nightingale rose or a coxcomb, after Florence Nightingale, who drew one in 1858 to show that far more soldiers in the Crimean War were dying of preventable disease than of their wounds. It helped persuade officials who would never have read the table. That is a high bar for any chart, and a good reminder of what this one is for: making a pattern impossible to ignore.
How to read it
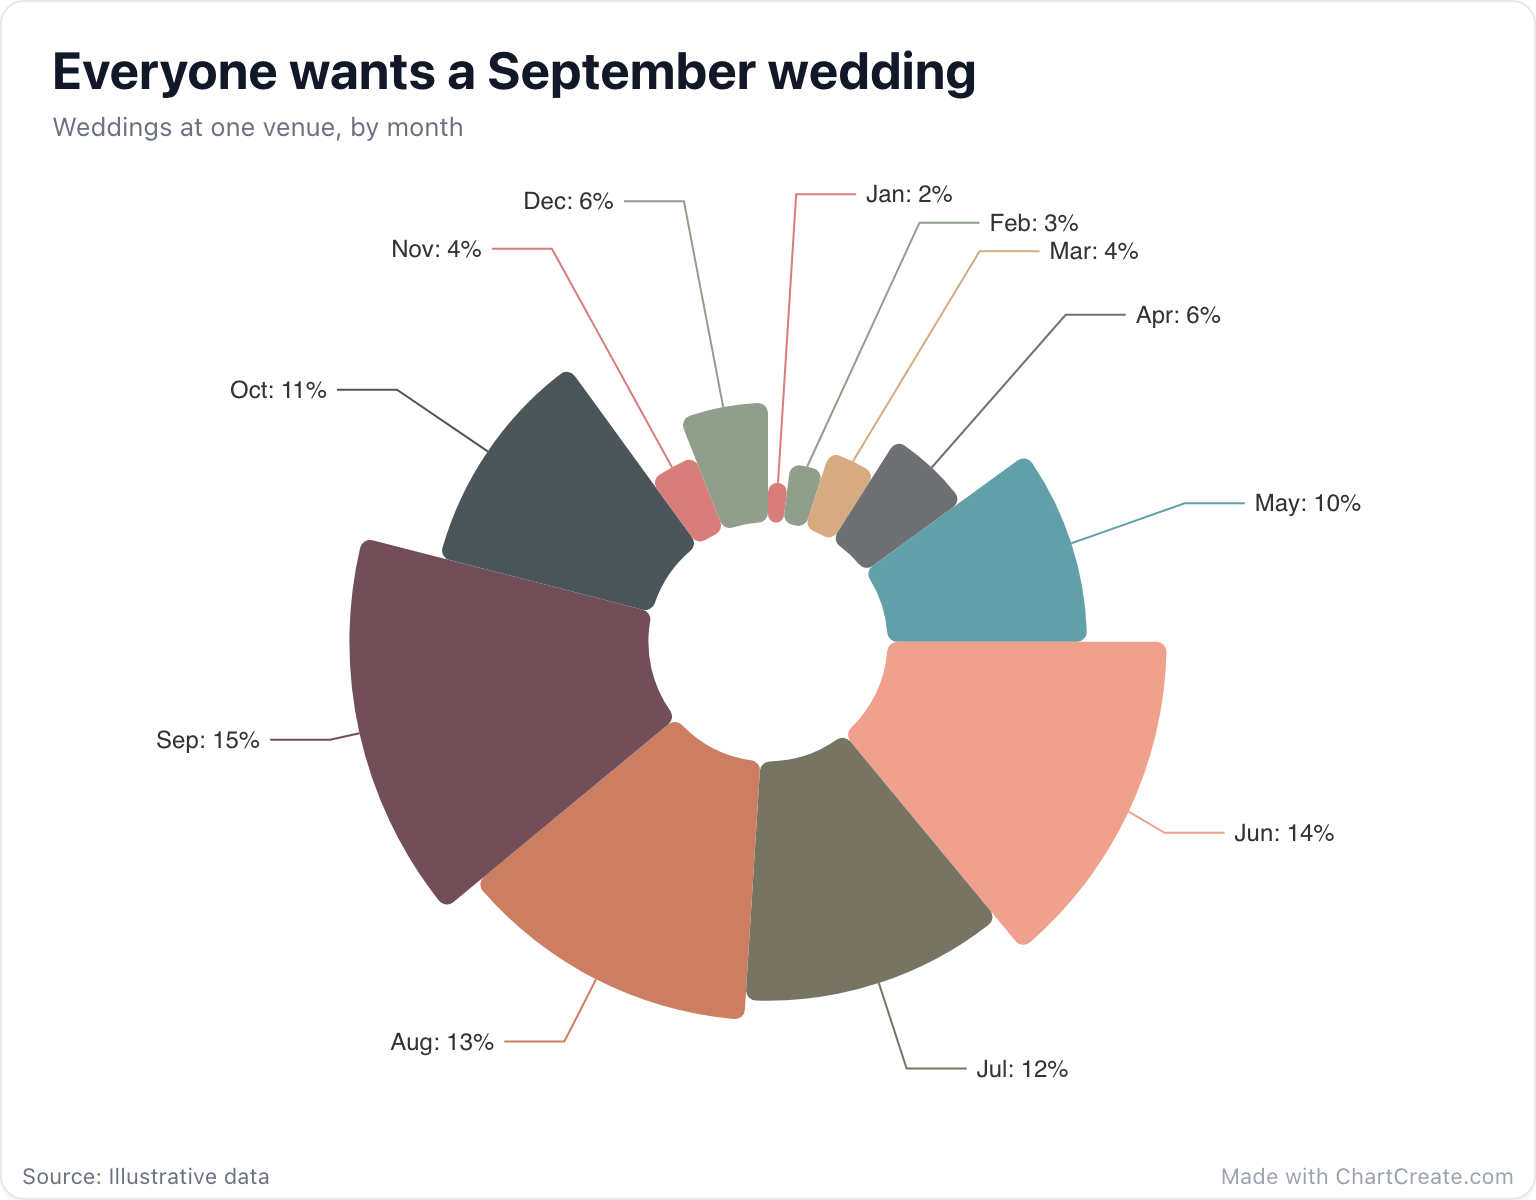
Each category gets a petal, placed around the circle in the order of your data, starting at twelve o’clock and running clockwise. Bigger values get bigger petals. At the wedding venue, January sits at the top with just 2 weddings, the petals swell through spring into a summer bloom, and September is the biggest of all with 15 before the year shrinks back toward a quiet winter. The labels show each month’s share of the year, and since there were exactly 100 weddings, the shares double as counts.
One detail worth knowing: in ChartCreate’s rose, a bigger value makes a petal both wider and longer. Nightingale gave every month an equal wedge and let only the length grow. This version makes the peak season dramatic and the quiet months tiny, which is great for showing a season and less fair for judging close calls. September’s 15 and June’s 14 look much alike, so let the labels settle that one.
A rose chart is for seeing the season. For the close calls, read the labels or use bars.
When to use it, and when not
Use a rose chart when the categories form a natural cycle and the shape of that cycle is the story: months of the year, days of the week, hours of the day. It has more visual punch than a bar chart, which makes it a good fit for a poster, an infographic or a social post. When the categories have no natural order there is no cycle to see, so use a bar chart. For a handful of parts of a whole, a pie chart is plainer and more honest about proportions.
Making one in ChartCreate
Two columns are all it needs: a name and a value, typed in, pasted from a spreadsheet or imported from a CSV or XLSX file. Keep the rows in cycle order, January to December, because the order of your data is the order of the petals.
Label Position puts the labels outside with leader lines, inside the petals as percentages, or turns them off. Outside is the better choice for twelve petals, since the smallest ones have no room inside. If you turn the labels off, switch the legend on in the Display section so readers can still match colors to months. A soft palette, like the Vintage one above, suits a showpiece chart.
A mistake to watch for
Watch out for zeros and negative numbers. A value of zero has no petal, so ChartCreate leaves it out, and a month can silently disappear from the circle. A petal can’t grow inward either, so a negative value is drawn by its size as if it were positive. If your data has gains and losses, a bar chart is the right tool.