How to make a sunburst chart that shows a hierarchy in rings
A sunburst chart draws a hierarchy as rings around a center: the big groups on the inside, their parts on the outside. It is the prettiest way to show how a whole breaks down, and then breaks down again.
Start in the middle and work outward. The inner ring splits the total into its main groups, each arc sized by its share. The next ring splits each group into its parts, sitting directly outside their parent, so you can always trace a slice back to where it belongs. Think of it as a pie chart with a family tree.
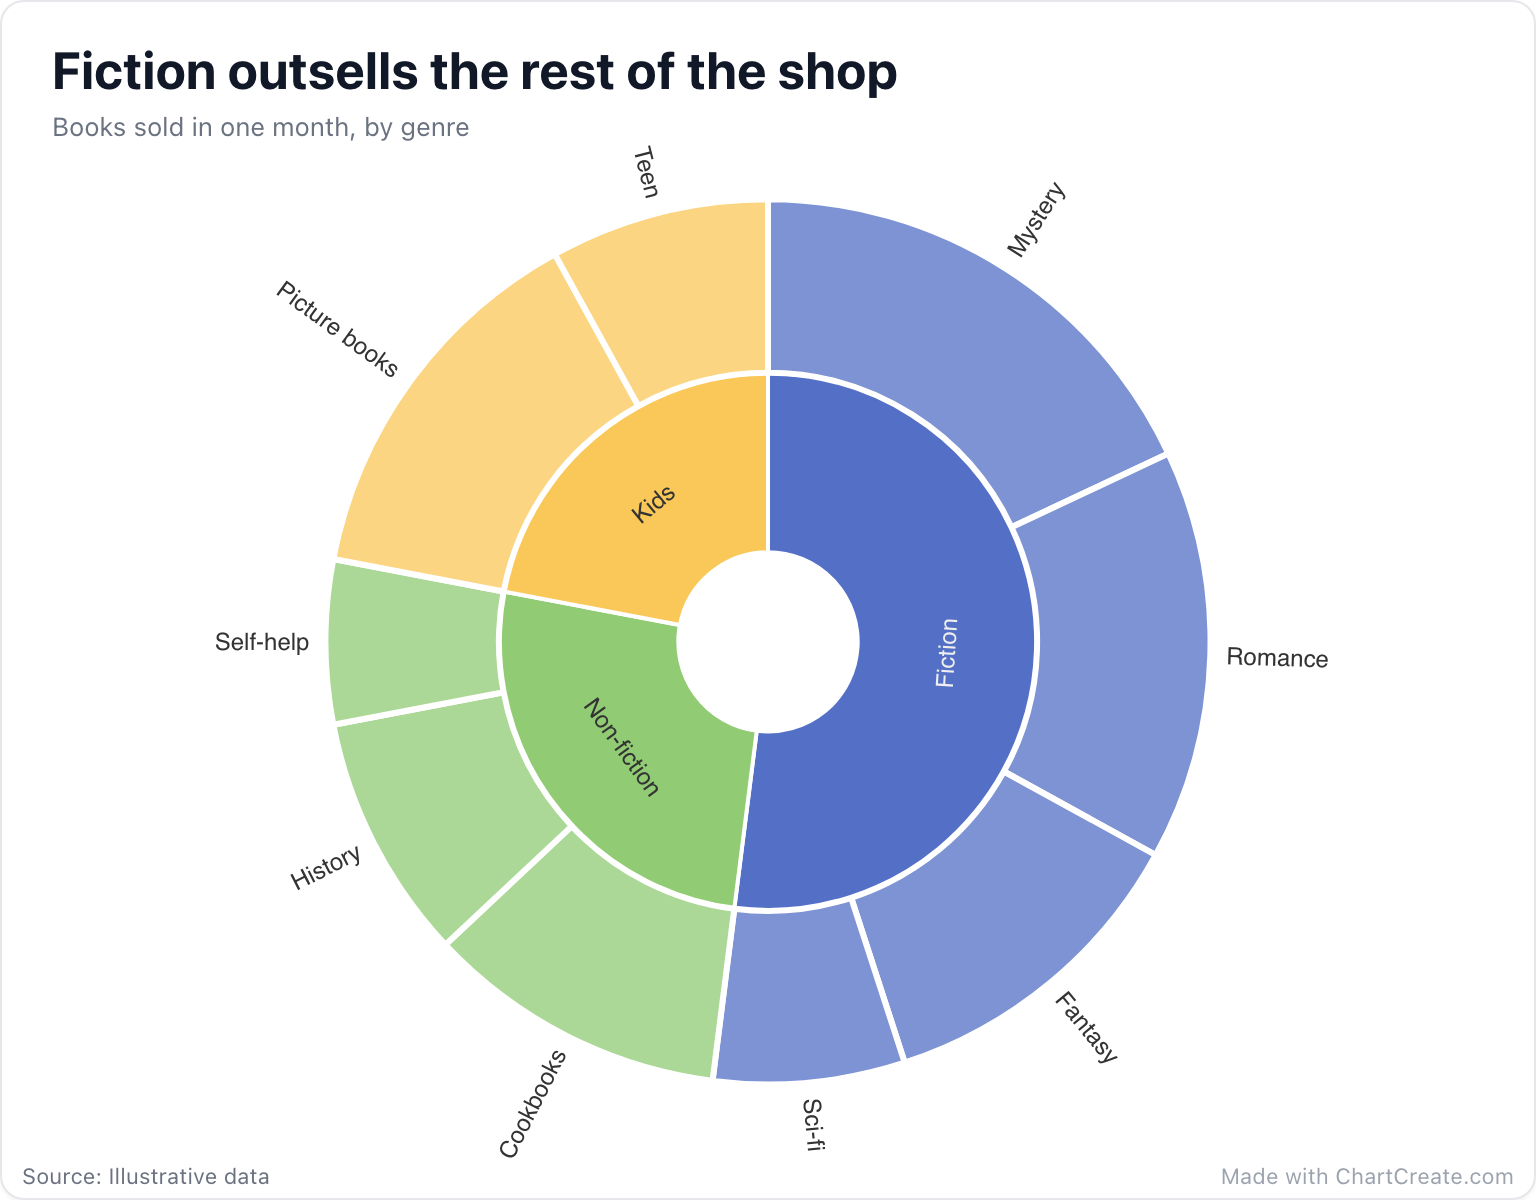
Reading the bookshop
The inner ring answers the first question: fiction sold 520 of the 1,000 books, more than non-fiction and kids put together. The outer ring answers the second. Within fiction, mystery leads with 180, twice as many as the whole history shelf, and even sci-fi, the smallest fiction shelf at 70, outsells self-help. And picture books, at 140, beat every non-fiction genre, a fact that a flat list of nine numbers would bury.
That is the sunburst’s strength: two levels of comparison in one picture, without losing sight of the whole. Its weakness is precision. Arcs on different rings are hard to compare by eye, and the slices on the outer ring get thin fast.
Two rings tell a story. Four rings are a dartboard.
When to use it
Use a sunburst when the hierarchy is the story: sales by region and then by country, a budget by department and then by team, survey answers by group and then by answer. Two or three levels read well. If comparing sizes matters more than the levels, a treemap uses the space better and fits more labels. For a single level, a pie or doughnut chart does the job with less ink.
Making one in ChartCreate
The data is the same tree as a treemap’s. In the tree editor, add a root, use the + button to add groups and items under it, and type a value into each item at the end of a branch; groups are sized by what is inside them. A single root in the middle is left out of the drawing, so the first ring you see holds your main groups and the center stays clear.
Each main group takes a color from your palette, and every slice in its branch inherits it, so a whole family reads as one color. The rings share the radius equally, however many levels you have. Labels on the inner ring follow the curve, and labels on the outermost ring sit outside it, where longer names have room. Hover over a slice in the editor to see its exact number and light up its path back to the center.
Common mistakes
The first is too many slices on the outside. If a group has fifteen children, the thin ones turn into unlabeled slivers, so fold the smallest into an "Other" item. The second is forcing data into a sunburst when it isn’t really a hierarchy. Every item needs exactly one parent: a book can’t sit under fiction and kids at the same time, and if your categories overlap, the chart will count things twice. ChartCreate links children to parents by name, so give every item a unique one.