How to make a tree diagram that maps out any hierarchy
A tree diagram draws a hierarchy the way you would sketch it on a whiteboard: one root, a few branches, and leaves at the ends. It is the clearest way to show what belongs to what.
Every item is a dot, and a line connects it to its parent. Read it from the root outward: the root is the whole thing, each branch is a part of it, and each leaf is a part of a part. Unlike a treemap or a sunburst, a tree diagram doesn't size anything by value. It shows structure and only structure, which is exactly what you want for an org chart, a site map, a folder of files or a family tree.
Plan a website with it
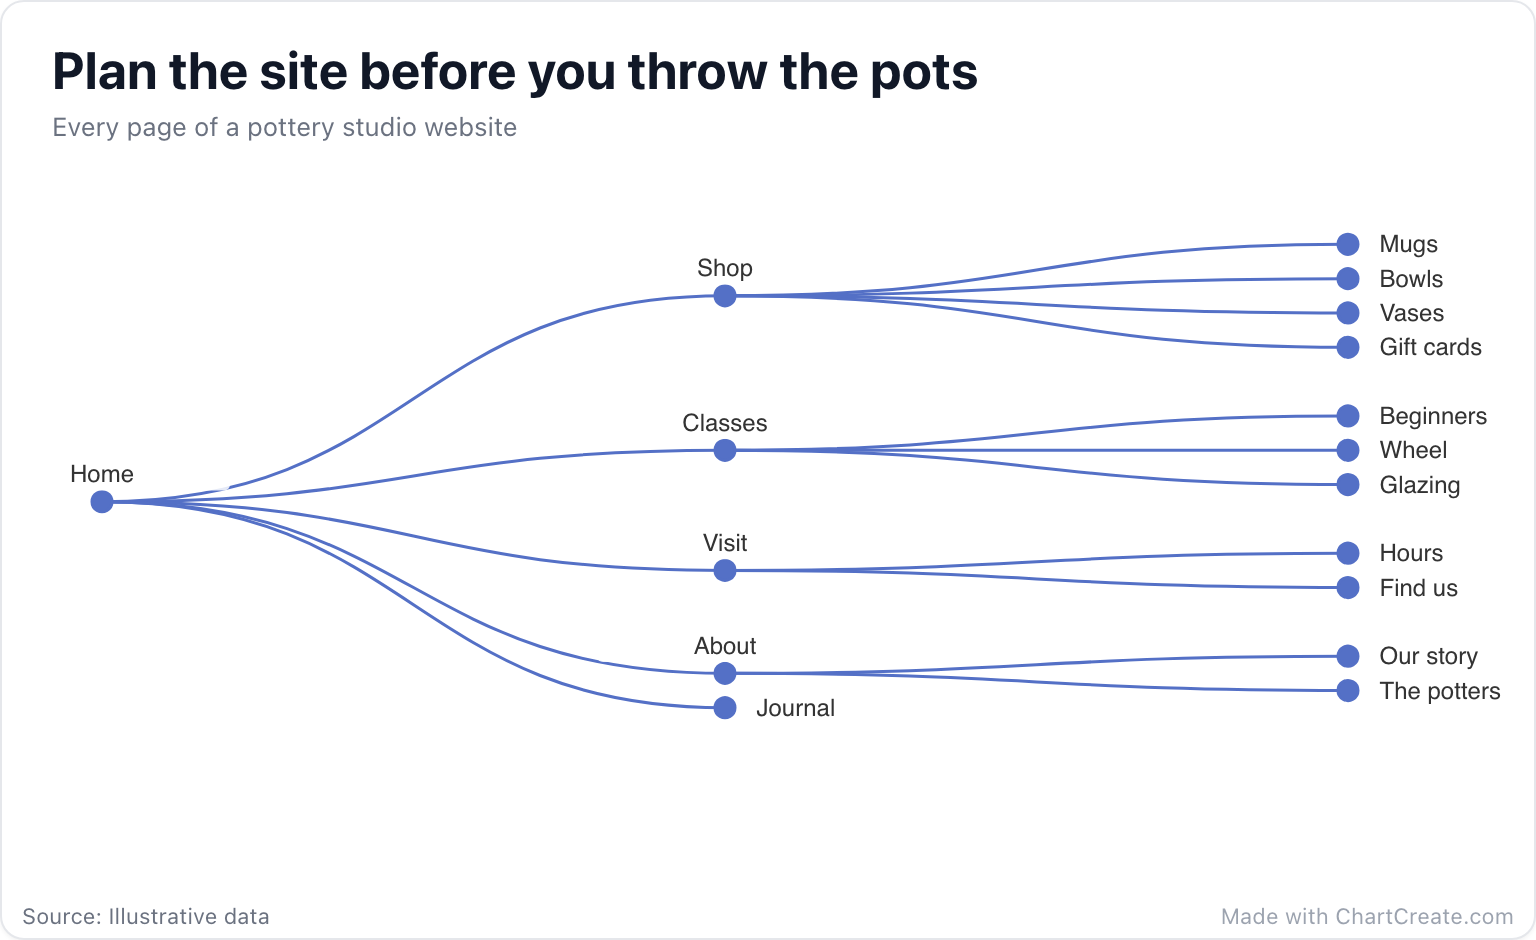
The example is the site map of a small pottery studio, drawn before anyone wrote a single page. Home sits on the left, five sections branch off it, and eleven pages hang off those. Seventeen pages in all, and the whole site fits in one glance.
Laid out like this, the planning questions answer themselves. Is any page more than two clicks from home? No. Is any section overloaded? Shop has four pages, which is plenty but fine. Does the Journal look lonely with no children? It does, and that's fine too: a blog doesn't need subpages to earn its place. Try asking those questions of a bulleted list and you will see why people draw trees.
When to use a tree, and when not to
Reach for a tree when the relationships are the point: who reports to whom, which page lives under which, how a big project breaks down into smaller tasks. It handles depth gracefully, since each level gets its own column of space.
It is the wrong chart when you care about size. If the question is which department spends the most, a treemap or a sunburst shows the hierarchy and the amounts at once. And if some items have more than one parent, you don't have a tree anymore. You have a network, and a network graph is the honest choice.
Every item in a tree has exactly one parent. If something has two bosses, you need a different chart.
Making one in ChartCreate
The data editor works like an outline. Start with a root, click + next to any item to give it a child, and type the names. Behind the scenes each row stores a name and the name of its parent, which is how ChartCreate wires up the branches. If two items end up with no parent, both still get drawn, as separate trees, so a family tree with two sets of grandparents works fine.
In the chart options, choose the Orthogonal layout for the classic org chart look, then pick a direction: left to right, right to left, top to bottom or bottom to top. Or choose Radial, which puts the root in the center and fans the branches out in a circle, a good fit for big, bushy hierarchies. While you work, you can click any branch in the preview to fold it away and click it again to bring it back, and drag or scroll to move around a large tree.
Keep it readable
Short labels matter more here than in any other chart, because long names are cut short to keep the branches tidy. "Wheel" is plenty. "Introduction to wheel throwing for absolute beginners" is a page title, not a label. Put the detail on the page itself.
A tree with dozens of leaves needs room. Give it a bigger canvas size before you export, or switch to the radial layout, which spreads the leaves around a circle instead of stacking them in one long column. And resist the urge to show everything. A tree that stops at the level your reader cares about beats a complete one nobody can read.