How to make a treemap that shows what takes up the space
A treemap packs a whole hierarchy into one rectangle and sizes every box by its value. It answers "where did it all go?" faster than any other chart.
Each rectangle is one item, its area is its value, and items in the same group sit together inside their group’s rectangle. The biggest boxes grab the eye first, which is usually what you want: in a budget, a product catalog or a hard drive, the big things are the ones worth talking about. Ben Shneiderman invented the treemap in the early 1990s for that last job, working out what was filling up a hard drive.
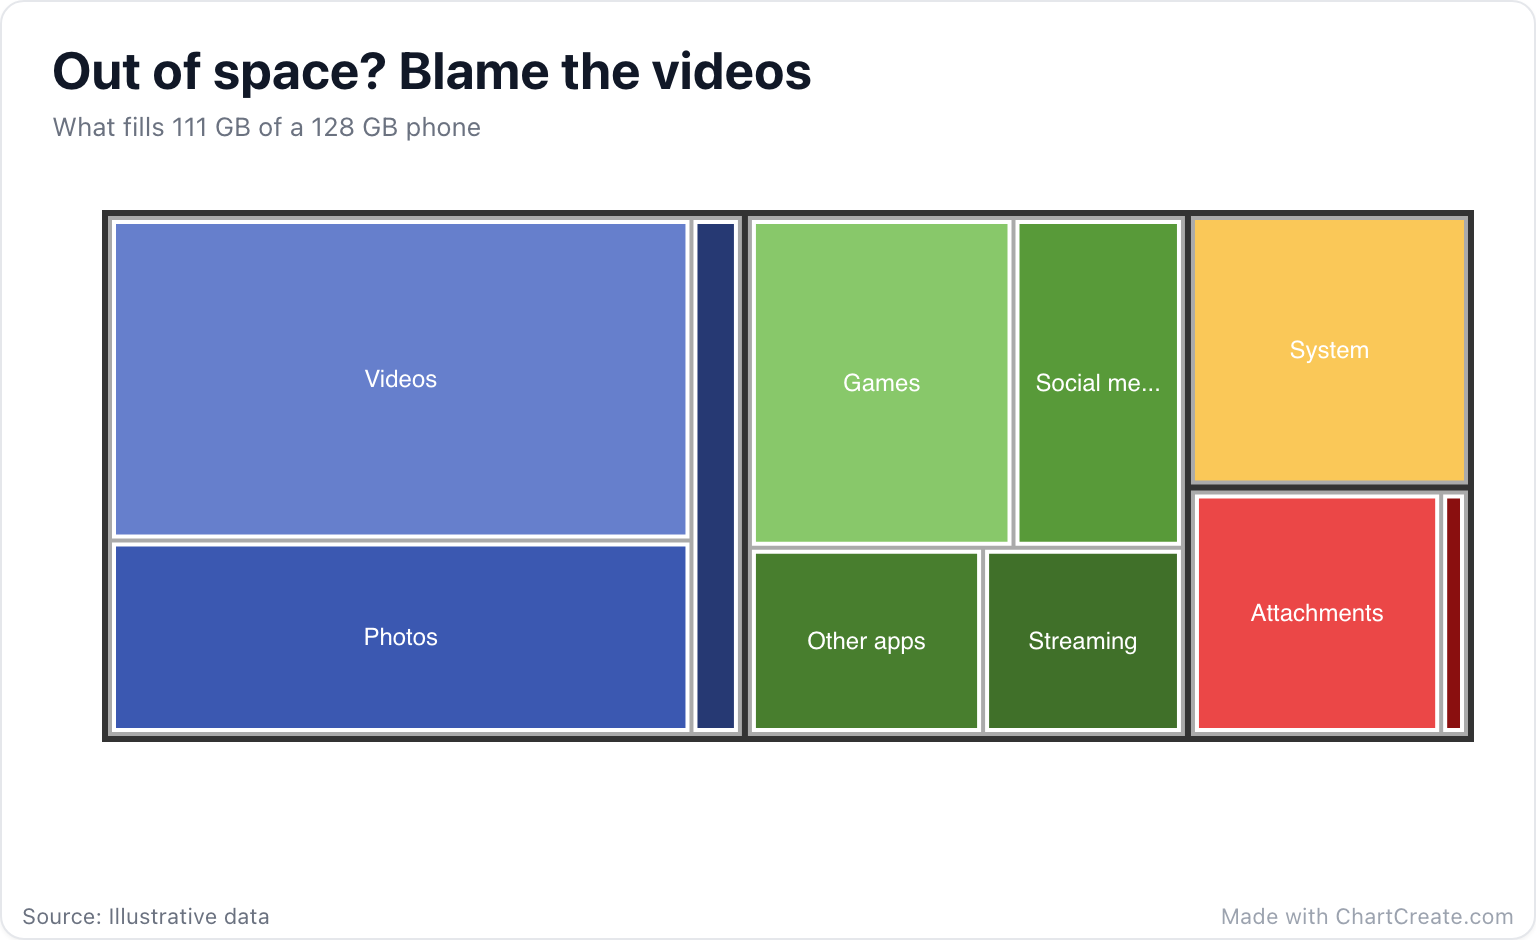
Reading the phone
Your eye goes straight to the biggest box, videos at 30 GB, and then to its neighbors. Videos, photos and screenshots share one color, so you can see that media as a group takes 52 of the 111 GB in use, nearly half. Games are the biggest app, but all the apps together still come second to the camera roll. And the tiny box for texts adds some perspective: years of messages take 1 GB, while the photos and videos people sent with them take 10.
Notice what the chart does not show: exact values. Most people can tell that one box is roughly twice another, but nobody reads 9 GB off a rectangle. That is fine. A treemap is for proportion and grouping, so put the one number that matters in the title or subtitle.
When the question is "where did it all go?", the answer is a treemap.
When to use it, and when not
Treemaps are good when you have many parts, nested groups and not much room: spending by category and subcategory, sales by product line, files by folder, a portfolio by sector. They cope with dozens of items, where a pie would be sliced into slivers nobody can label. For a handful of parts with no grouping, a pie or bar chart is simpler. If the levels of the hierarchy are the story, a sunburst chart shows the same data as rings you can follow from the center.
Making one in ChartCreate
Treemap data is a hierarchy, so ChartCreate gives you a tree editor instead of a flat table. Add a root, use the + button on any item to give it children, and type values into the items at the ends of the branches. Only those end items take a value; each group is sized by what is inside it.
Each top-level group takes a color from your palette, and the items inside it share that color in different shades, with dark lines between the groups. Only the items’ own names are printed on the boxes, not the group names, so give items names that make sense on their own: "Social media" rather than "Social". Hover over a box in the editor to see its exact value.
Mistakes to avoid
Don’t use a treemap for values that can be negative, like profit and loss, because an area can’t be less than zero. ChartCreate draws a negative number by its size so it doesn’t vanish, which means a loss and a gain of the same amount look identical. A waterfall or bar chart is the honest choice there.
And resist nesting four or five levels deep. Groups and the items inside them read at a glance, and ChartCreate draws those two levels; anything nested deeper won’t show in the picture.