How to make a world map chart, one country at a time
A world map colors each country by your data, so the answer to "where?" is visible before anyone reads a word. Type a list of countries, add a value or a label to each, and the map fills itself in.
Numbers or labels: two kinds of map
Give the map numbers and you get a choropleth: a color scale from light to dark, where darker means more. Give it words and you get a categorical map, with one color per label and a legend entry for each, like Visited and Want to go. You do not have to pick a mode. ChartCreate looks at the second column: if the values are mostly numbers it draws a scale, otherwise every distinct label gets its own color.
Categorical maps answer the question "which group is each country in?", which makes them ideal for status. Where a product is sold, which team covers which market, where you have traveled. The example below is a launch plan.
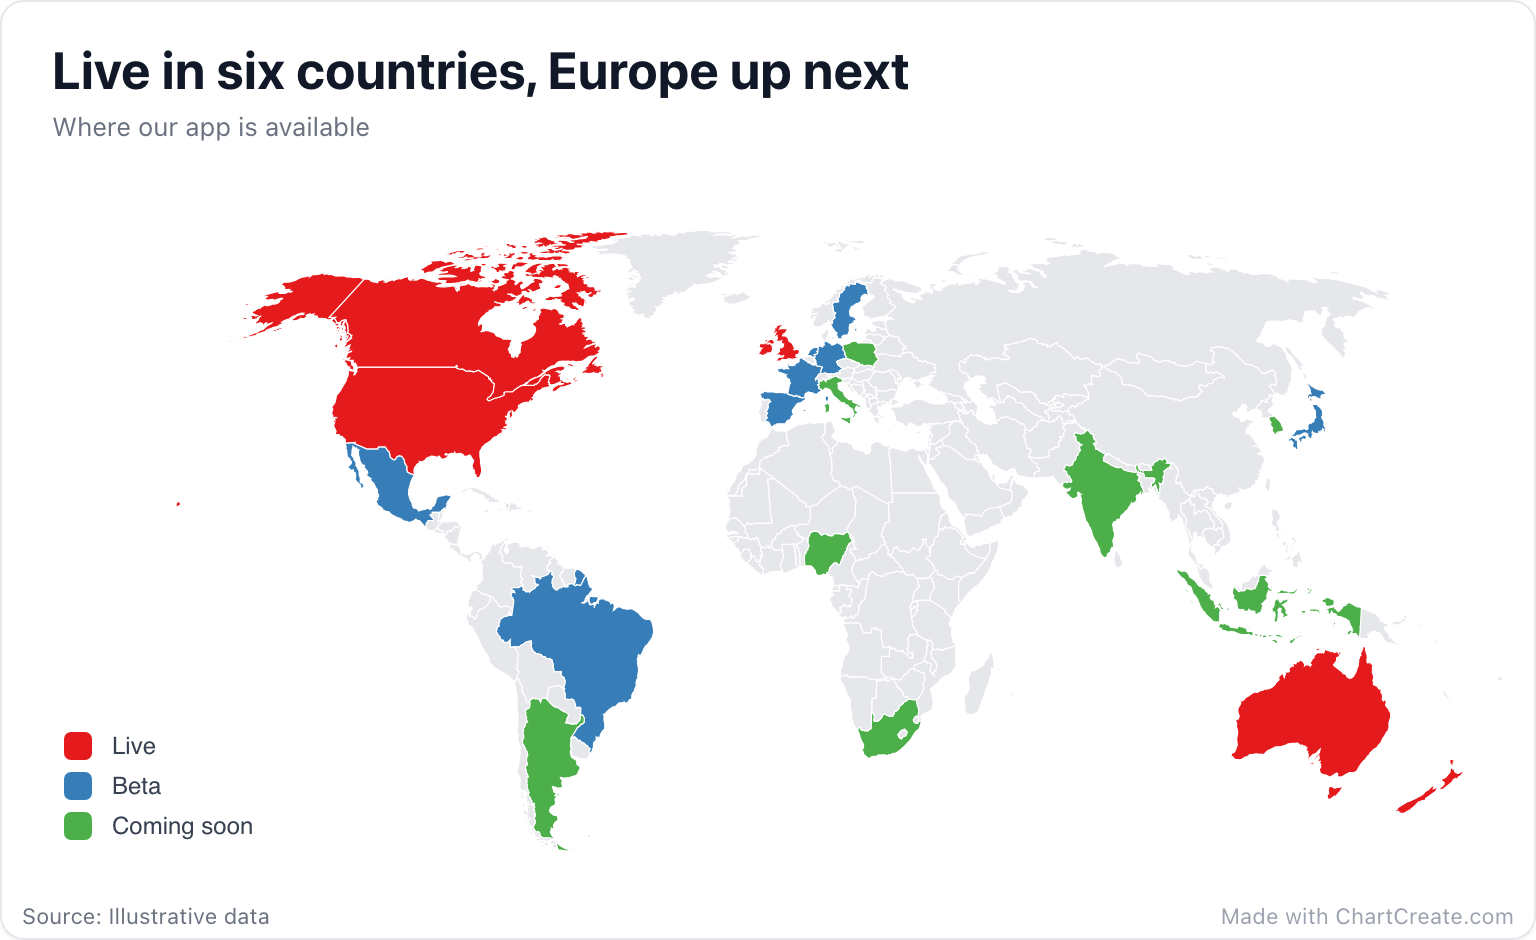
Twenty-two rows, three labels, and the story is instant: English-speaking markets first, a beta that hops across Europe, Japan and Latin America, and a long list of what comes next. The legend lists labels in the order they first appear in your data, so putting the Live rows on top puts Live at the top of the legend. Countries without a row stay gray, which here quietly says "not on the roadmap yet".
Country names, codes and typos
Matching is forgiving. Upper or lower case and accents do not matter, and the map understands the long forms that datasets export ("Russian Federation", "Viet Nam", "Korea, Rep."), everyday short forms like USA, UK and Holland, country names in Spanish, Portuguese, French and German, and two- and three-letter ISO codes for the most-used countries. The launch map was typed as codes straight from a spreadsheet: USA, GBR, DEU. Any row that matches no country is highlighted in amber in the Data tab, so a typo never quietly drops off the map.
Paste two columns from Excel or Google Sheets, or import a CSV or XLSX file. On a categorical map you can skip typing altogether: click any country, pick its label from the popover or type a new one, and the row is added for you.
Choosing a projection
Flattening a globe always bends something. The default, Natural Earth, is the atlas compromise: shapes and sizes both look believable. Mercator, the one web maps use, keeps shapes but swells everything near the poles, so Greenland looks as big as Africa, which is about fourteen times larger. Equal area keeps every country at its true relative size, the honest choice when big areas would otherwise read as big numbers. Flat simply plots longitude against latitude. You will find all four under Projection in the Map section of the Style tab.
A map is for "where". If the question is "how much more", use a bar chart.
When a map is the wrong chart
A map is brilliant at geography and poor at precise comparison. Nobody can tell a 41 from a 44 by shade alone, and a small country with a big number almost disappears next to Russia or Canada. When the ranking matters more than the location, a bar chart of the top fifteen countries will serve your reader better, and you can always use both.
Keep categorical maps to about six labels. Beyond that the colors start to look alike and readers end up matching shades against the legend one by one. Merge rare labels into a broader one, or split the story into two maps.
Finishing touches
The Map section also sets the border width and color, an optional ocean color, and the color of countries without data, or hides them entirely. Country names start switched off: they only ever label the countries in your data, but past a dozen or so they turn into wallpaper. Download a PNG, JPG or SVG, with sizes ready for Instagram, X or a 1920 by 1080 slide. It is free with no account, and every export carries a small "Made with ChartCreate.com" credit.