How to make an Asia map when one country breaks the scale
An Asia map colors each country by your data, from Turkey to Japan and from Russia down to Indonesia. Asia's extremes also make it the perfect place to learn the one map setting most people never touch.
What an Asia map is good for
A map of Asia shows the regional patterns a table hides: the coastal economies against the interior, Southeast Asia moving as a block, the Gulf states standing apart. Give it a column of countries and a column of numbers and each country takes a shade from pale to dark. Give it words instead and each label gets its own color.
The map covers fifty countries and territories, including Russia, Turkey, the Middle East and the Caucasus. It uses an equal-area projection centered on the continent, so Siberia is shown at its true relative size instead of being stretched across the top of the map.
The outlier problem
A color scale spreads its classes evenly from your lowest value to your highest. That works until one value is far bigger than the rest. In the bubble tea example, Taiwan has 180 shops per million people and the runner-up, Singapore, has 46. On an automatic scale with four steps, each step is about 45 wide. Taiwan gets the darkest color, and the other twelve countries, from Singapore at 46 down to India at 2, all land in the palest class. One country broke the scale, and the map has nothing left to say about the rest.
If one value breaks your scale, cap the scale, not the value.
The fix is a cap. Set Scale max to a value that suits most of the data, 50 here, and anything above it takes the darkest color. Taiwan still stands out, its label still says 180, and the rest of the continent finally gets the full range of shades.
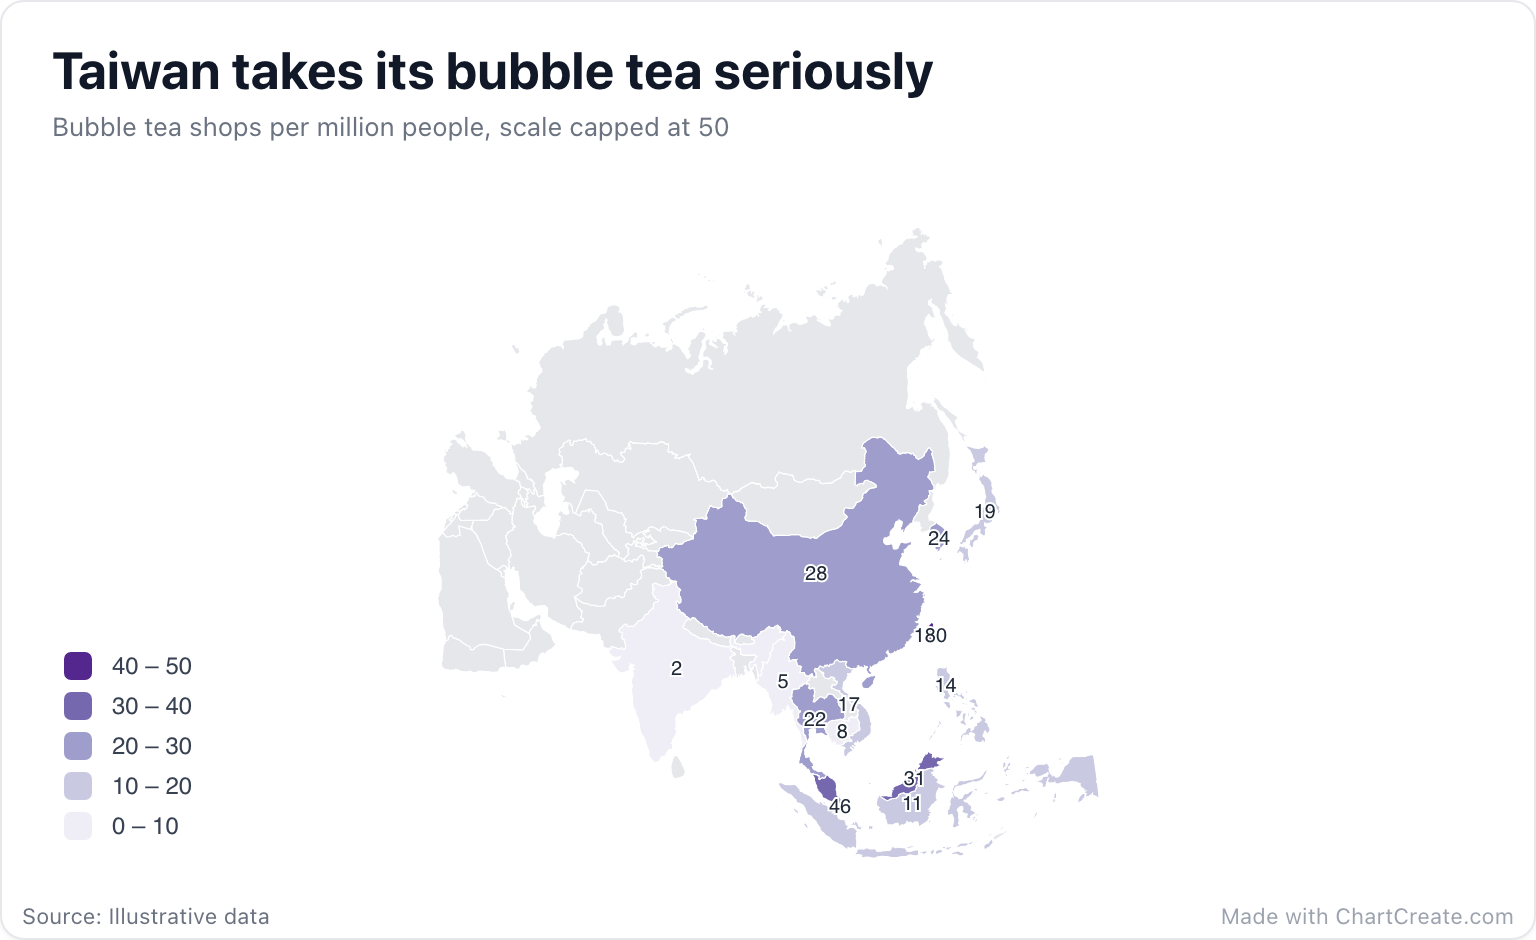
With a cap of 50 and five steps of 10, the middle of the pack separates cleanly: Malaysia on its own between 30 and 40, China, South Korea and Thailand between 20 and 30, Japan and Vietnam a step lower, and Cambodia, Myanmar and India together in the palest class. Because the top class now reads 40 to 50 while Taiwan sits at 180, the subtitle says the scale is capped. Readers deserve to know.
Setting it up in ChartCreate
Type or paste two columns, or import a CSV or XLSX file. The example uses three-letter ISO codes (TWN, SGP, MYS), and two-letter codes work as well for the most-used countries. Dataset spellings match too, such as "Korea, Rep.", "Viet Nam" and "Lao PDR", along with country names in Spanish, Portuguese, French and German. Rows that match nothing are highlighted in amber in the Data tab.
In the Map section of the Style tab, type 0 and 50 into Scale min and max and choose five steps. Turn on Values on map to print each number on its country, which helps small places like Singapore that are barely a dot at continent scale. The example uses Purples; Heat and Yellow-blue are good choices too for data that only goes up.
When the outlier is the story
Sometimes the giant number is the whole point. If you want readers to feel that Taiwan has nearly four times as many shops per person as Singapore, a bar chart says it louder than any shade can. Use the map when the neighborhoods matter, and the bar chart when the gap does.
Download the finished map as a PNG, JPG or SVG, with sizes ready for a slide or a social post. It is free with no account, and every export carries a small "Made with ChartCreate.com" credit.