How to make an animated bubble chart that moves through time
A bubble race is a scatter plot that learned to move. Press play and every bubble travels through the years, growing and shrinking as it goes, while the year ticks over in the background.
Each bubble is one thing you are tracking: a country, a company, a neighborhood. Its position shows two numbers and its size shows a third, just like a still bubble chart. The difference is that the chart has one frame per period and glides from one to the next, so instead of comparing dots you watch them travel. The motion is the insight: who moved, in which direction, and who got left behind.
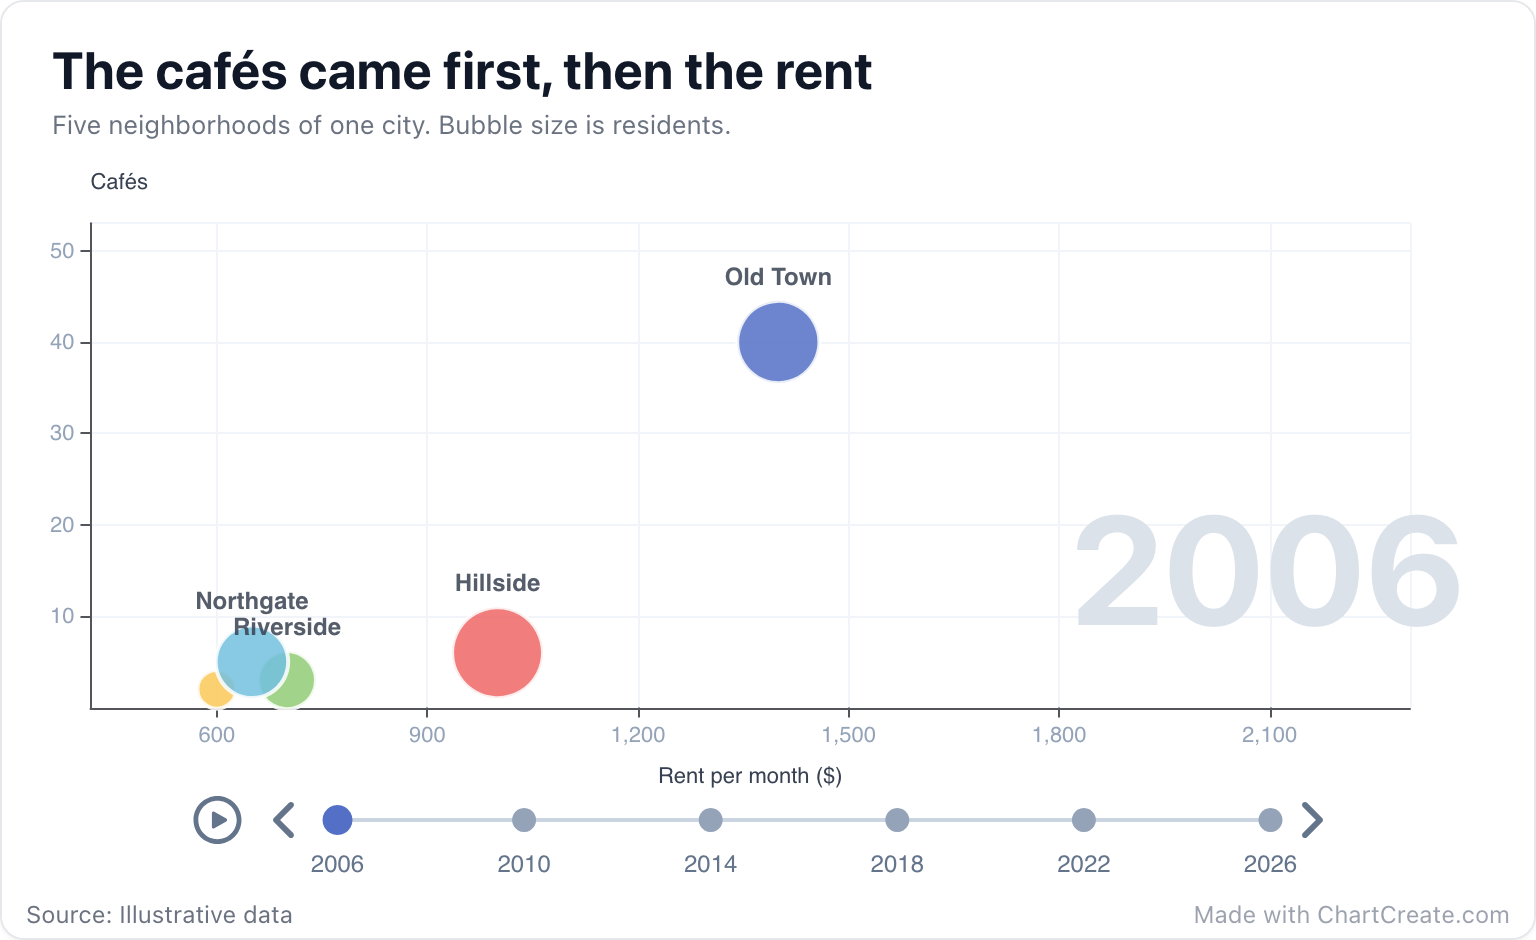
What the neighborhood example shows
Watch Riverside. Between 2010 and 2014 its bubble shoots upward, from 9 cafés to 22, while the rent barely moves, from $750 to $850. Then the direction turns. By 2022 the rent has almost doubled to $1,600, and 19,000 people live there, up from 9,000 in 2006. Cafés first, rent second. Now watch Harbor, which sets off on the same journey around 2018, about a decade behind. Old Town, meanwhile, just drifts steadily to the right, getting pricier every few years without much else changing.
A still chart could show you 2006 and 2026 side by side. Only the animation shows the order things happened in, and here the order is the whole story.
If the order of events is the story, animate it. If only the before and after matter, a still chart says it faster.
When it earns its keep
Use a bubble race when you have the same handful of things measured at several points in time, and the path they take matters. Five to fifteen bubbles over five to thirty periods is a comfortable range. With many more bubbles the screen turns into a ball pit. If you only care about one number, a bar chart race is easier to follow. And if your readers cannot press play, in a printed report or an email, show a line chart or a couple of still bubble charts instead.
Making it in ChartCreate
The data has five columns: the period, the name, the value along the bottom, the value up the side, and the value that sizes the bubble. You enter it in the Data tab one period at a time, where each period shows a card for every bubble with its three numbers. Adding a period copies everyone's latest values forward, so you only change what moved. Adding a bubble adds it to every period, and renaming one renames it everywhere.
Years are put in order for you. Other period labels, like "Q1" or "Spring", play in the order they first appear. A newcomer can join halfway through: leave it out of the earlier periods and it pops in with its first row. The axes stay fixed for the whole animation, so a bubble only moves when its numbers do, and it is the bubble's area, not its width, that follows the size value.
In the Style tab you can set the seconds per period, switch the bubble labels on or off, give any bubble its own color or a logo, and write a caption for any period to narrate the turning points as they happen. Mind the speed: at half a second per period nobody can follow anything. The default of 1.6 seconds is a good start, and slower is better when a lot is moving at once.
Exporting the animation
A bubble race is made to be watched. Download it as a video (MP4 in browsers that can record it, WebM otherwise) for Reels, TikTok or a presentation, or as an animated GIF for places where GIFs play on their own. The Reels/TikTok size gives you a tall 1080 by 1920 frame. The length is the seconds per period times the number of periods, plus a hold on the last frame so viewers can take in the ending. You can also save a PNG or JPG of the period on screen. SVG is not available for animated charts.