How to make a bump chart that tracks who overtook whom
A bump chart is the leaderboard of charts. It ignores how big the numbers are and shows the one thing people really argue about: who is ahead.
Each line is one contestant. Its height is its rank, with first place at the top, and the horizontal axis is time. When two lines cross, somebody overtook somebody. A season of league tables, a decade of best-selling cars, the monthly order of your top five products: if the story is about position, a bump chart tells it faster than any table.
How to read it
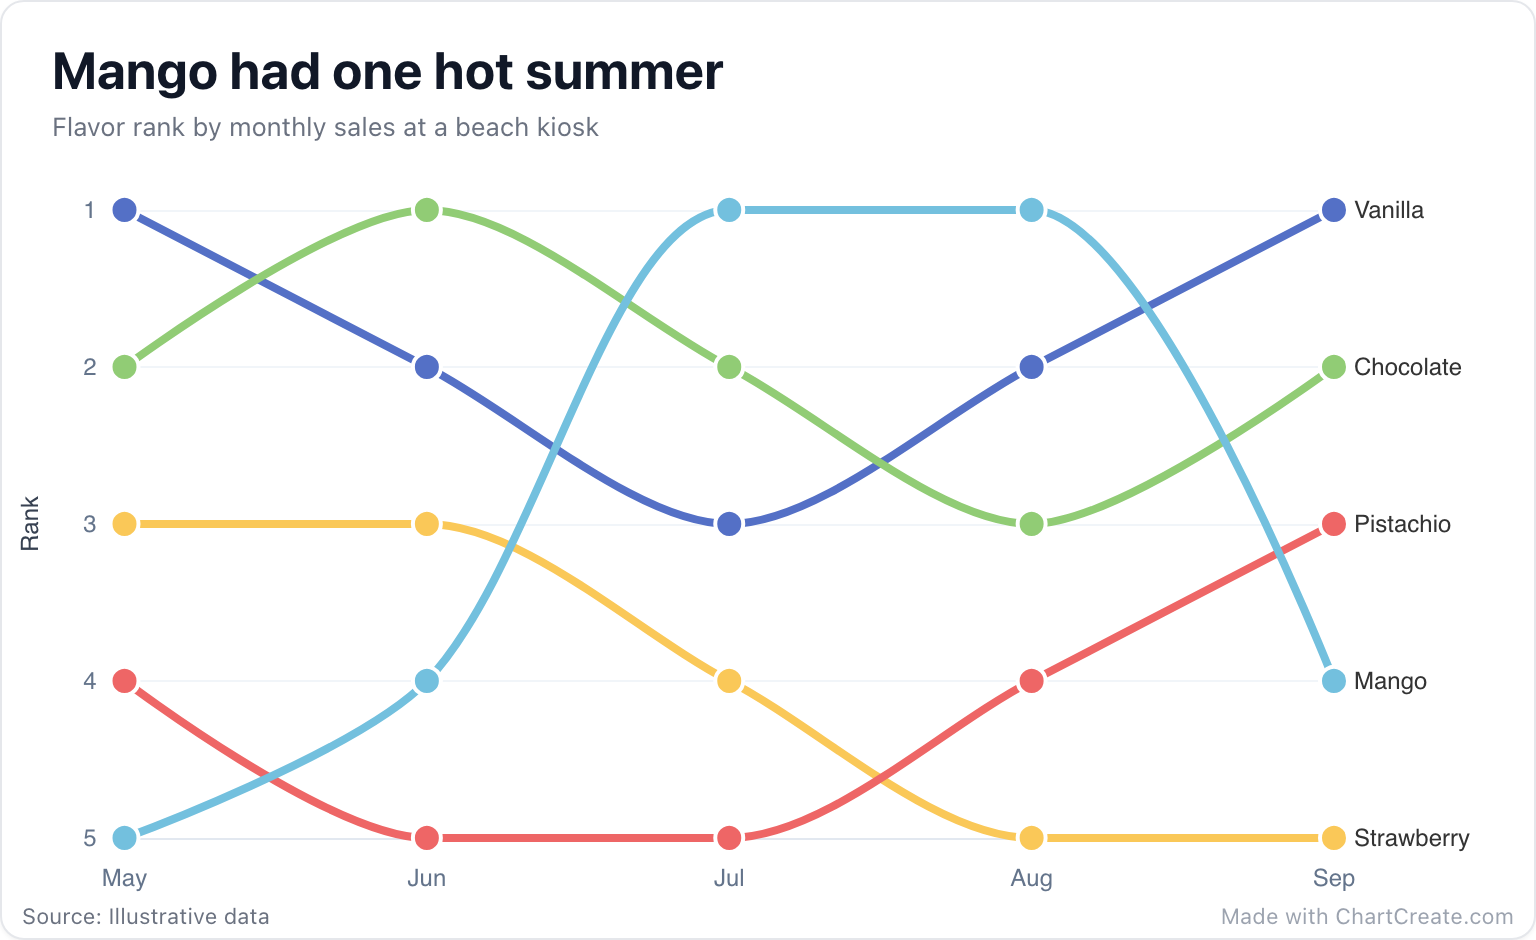
Follow one line at a time. Mango starts at the bottom in May, edges up to 4th in June, and jumps straight to the top in July, where it stays through August. Then the beach empties, the heat breaks, and mango tumbles back to 4th in September while vanilla, the dependable classic, reclaims first place. Strawberry is the quiet loser: 3rd for two months, 4th in July, then last for the rest of the season. You did not need a single sales figure to follow any of that, and that is the point.
A bump chart answers "who is winning?" and politely refuses to answer "by how much?"
When to use it, and when not
Use a bump chart when rank is the story and the raw numbers would only distract: league positions, the top apps in a store, the most popular baby names by decade. It is at its best with three to eight contestants and four to twelve time points. More than that and the crossings knot into a plate of spaghetti.
Be honest about what ranks hide. First and second place might be one sale apart or ten thousand, and the bump chart draws them the same distance apart either way. If the gaps matter, use a line chart of the actual values. If you want the ranking to feel like a race, with bars sliding past each other, a bar chart race animates the same idea.
Making it in ChartCreate
Each row is a moment in time and each column after the first is a contestant. The cells hold ranks, not amounts: 1 for first, 2 for second, and so on. ChartCreate draws the ranks you give it and does not work them out from sales figures, so if your spreadsheet has the raw numbers, rank them there first (the RANK function in Excel and Google Sheets does it in one go). Then paste the table into the Data tab or import it as a CSV or XLSX file. The rank axis runs from 1 at the top down to the number of contestants.
Every line carries its name at its right-hand end, so you can switch the legend off in the Style tab, as the example does, and give the chart the room. Keep the names short so those end labels fit, and pick a palette where every contestant gets a clearly different color. If someone sat out a month, leave that cell blank: the line breaks there instead of plunging off the chart.
Two common mistakes
The first is ties. If two flavors share 2nd place and you type 2 for both, their dots land in the same spot and one hides behind the other. Pick a tie-break, or keep the tie and say so in the description. The second is ranks from a bigger field. If you track five contestants out of a league of twenty, a team in 8th place sits below the bottom of a five-row axis and its line falls out of view. Rank the contestants among themselves, from 1 to the number of columns, or add the rest of the field.
When it looks right, write a title that names the twist, not the topic, and export a PNG or SVG, or a short video of the lines drawing themselves in.