How to make a calendar heatmap that shows a year at a glance
A calendar heatmap gives every day of the year its own small square and colors it by value. Habits, streaks and holidays show up whether you meant them to or not.
It is laid out like a wall calendar turned on its side: one column per week, one row per day of the week, and the months labeled along the top. The darker the square, the bigger the number. If you have ever seen the contribution graph on a coder's profile page, you already know how to read one.
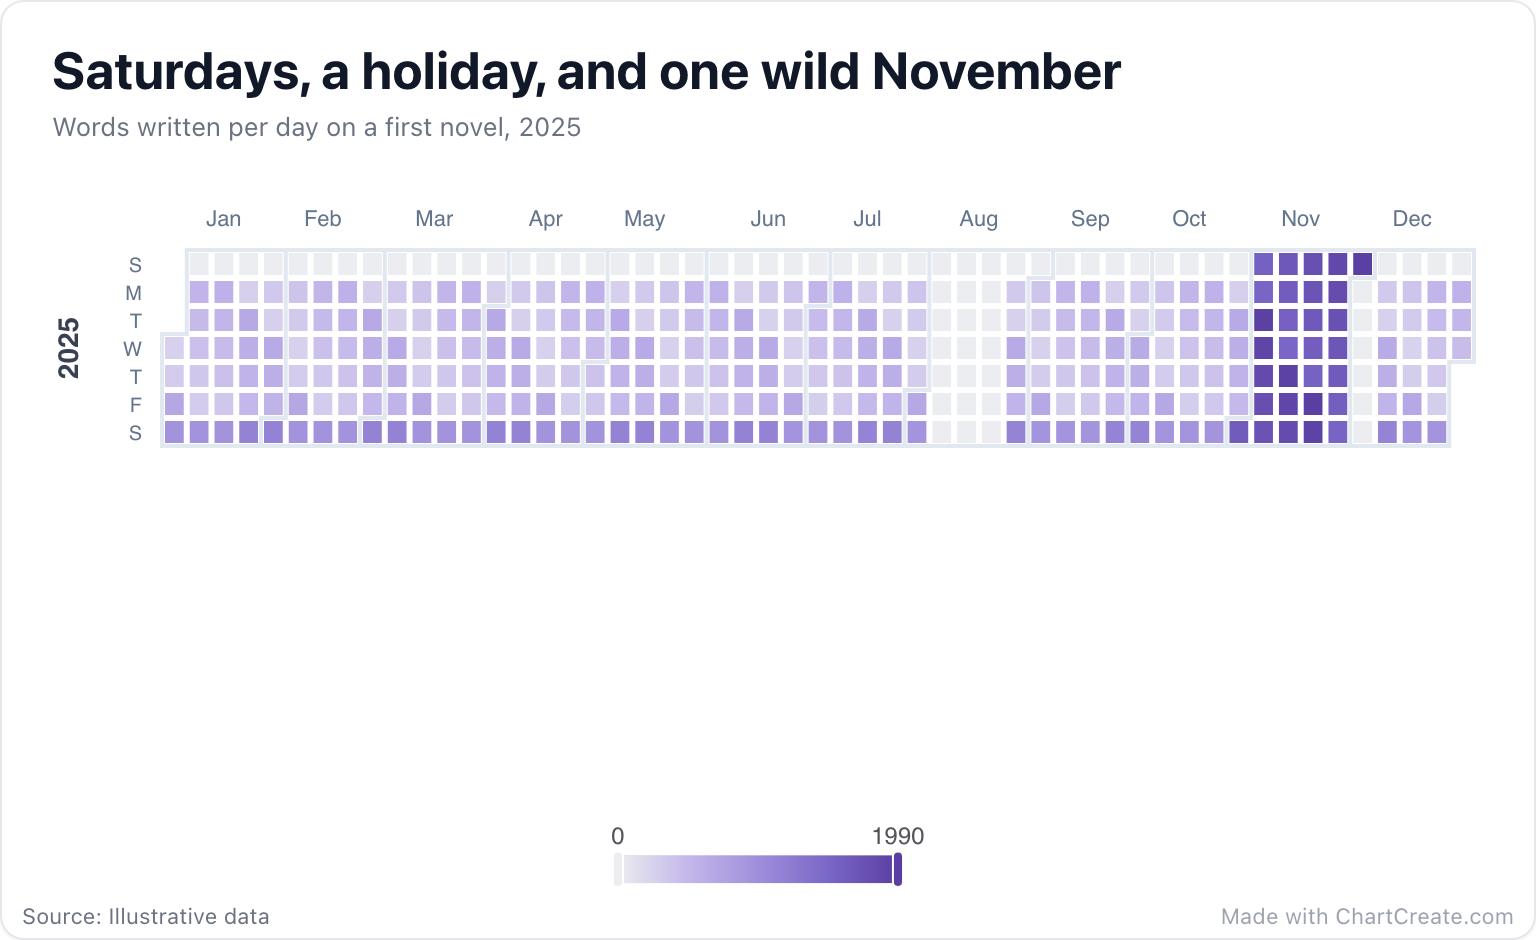
What the novel example shows
This is a year of writing a first novel, 194,580 words in all. Read it row by row first. Sundays are empty all year. Saturdays run darker than the weekdays around them, because Saturday was the long session, while the weekday mornings stay pale at 250 to 700 words.
Then read it across. There is a three-week hole in August, which was a holiday. Then November turns solid dark purple: a 50,000-word challenge month, written every single day, that ended at 52,080 words, with the busiest day at 1,990 words on November 21. The first week of December is completely blank. Nobody needs that one explained.
When a calendar heatmap works
Use it for anything you count per day: sales, sign-ups, workouts, support tickets, pages read, steps walked. Nothing beats it for spotting weekly rhythms, seasons and gaps, because each day of the week lines up into its own row and the months sit side by side.
It is not the chart for the trend itself. If the question is "are we growing?", a line chart of weekly or monthly totals answers it faster. And it needs daily data. Twelve monthly numbers on a calendar look like twelve lonely squares in a sea of blank ones.
A calendar heatmap doesn't tell you how much. It tells you when.
Making one in ChartCreate
You need two columns: a date and a value. Dates are written as year, month and day with dashes, like 2025-11-21. Most spreadsheets can format a date column that way, so do it before you copy, then paste both columns into the data table or import a CSV or XLSX file. Days you leave out simply stay blank, and impossible dates like February 30 are skipped rather than quietly moved into March.
In the Style tab, pick one of five color schemes: green, blue, purple, orange or red. Each runs from pale gray for the lowest value to a deep shade for the highest, and the scale bar underneath has handles you can drag to pick out a range. The chart options switch between the horizontal layout and a vertical one, where the weeks run down the page. Data from several years works too: each year gets its own calendar, stacked one above the other or side by side, and the squares shrink to fit. One year tells the cleanest story; two let you compare.
Two common mistakes
Dates in the wrong format are the usual reason a calendar comes out empty. 11/21/2025 and 21.11.2025 won't be read, but 2025-11-21 will.
The other is a single extreme day. The darkest color goes to the highest value, so one huge day, such as a launch or a viral post, can wash every other day out to pale gray. Ask whether the chart is about that day or about the rest of the year. If it is the rest of the year, consider leaving the outlier out and saying so in the subtitle.