How to make a candlestick chart that shows the whole day
The candlestick chart is what finance reaches for when a line chart is not telling the whole story.
Every candle packs four numbers into one shape: where the price opened, where it closed, and the high and low it touched in between. The body runs from open to close, the thin wicks reach out to the extremes, and the color tells you the ending before you read anything else: green closed higher than it opened, red closed lower.
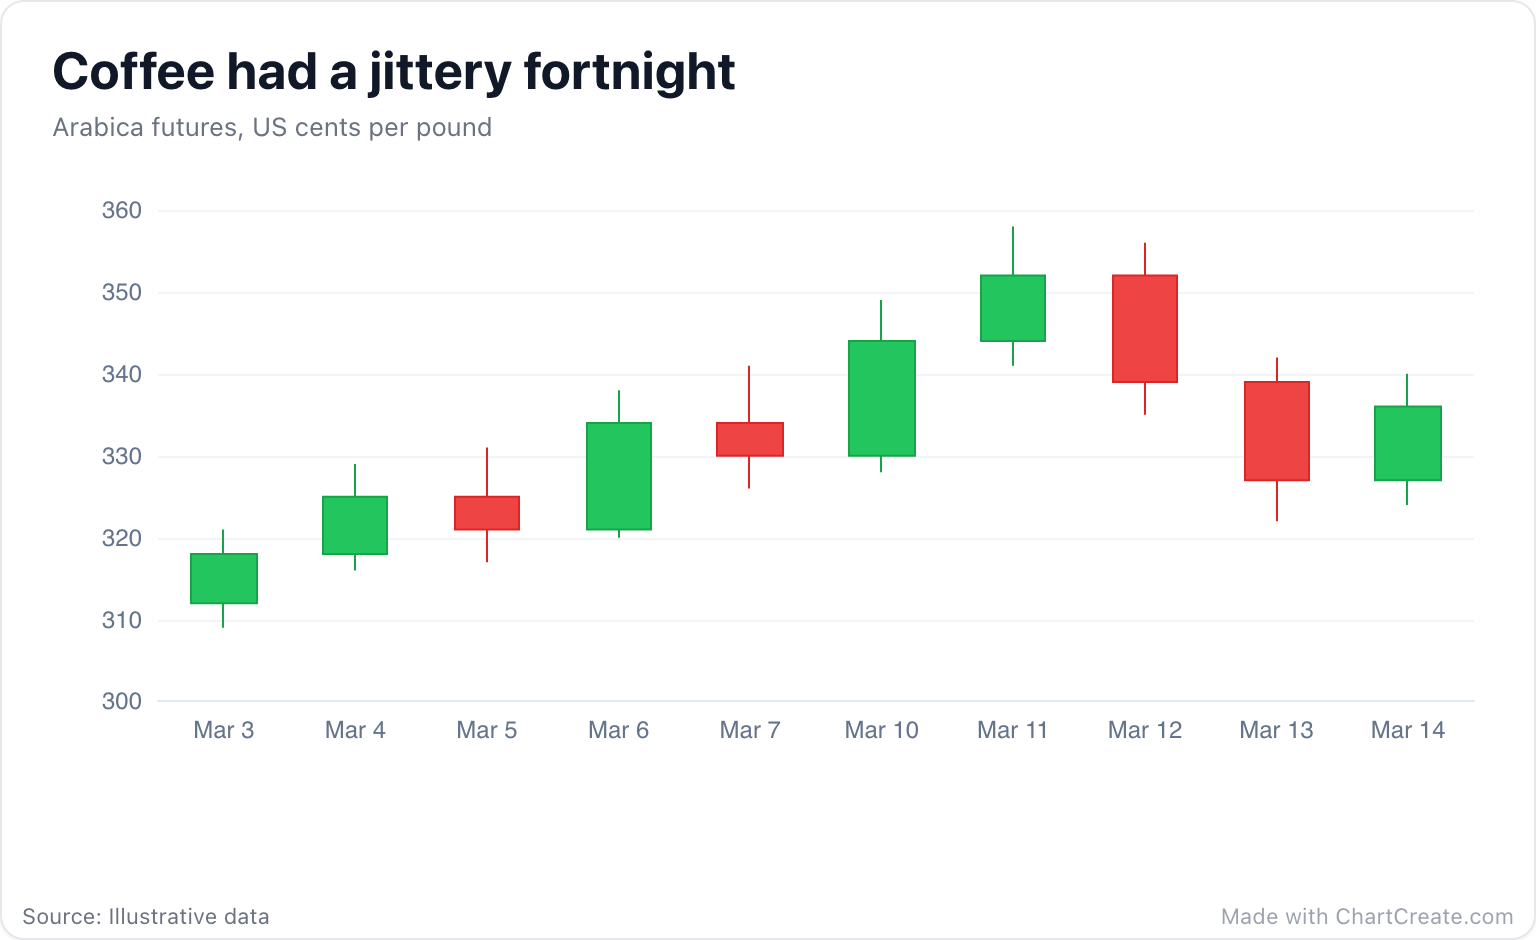
How to read a candle
Start with the bodies. A run of tall green bodies is a market that kept closing higher than it opened, day after day. A long red body is a day that started well and went downhill. Then look at the wicks: a long wick with a small body means the price went on an adventure during the day and came back home by the close. That is volatility, and it is exactly what a line chart of closing prices quietly throws away.
A line chart tells you where the price ended up. A candlestick tells you what kind of day it had getting there.
Not just for stocks
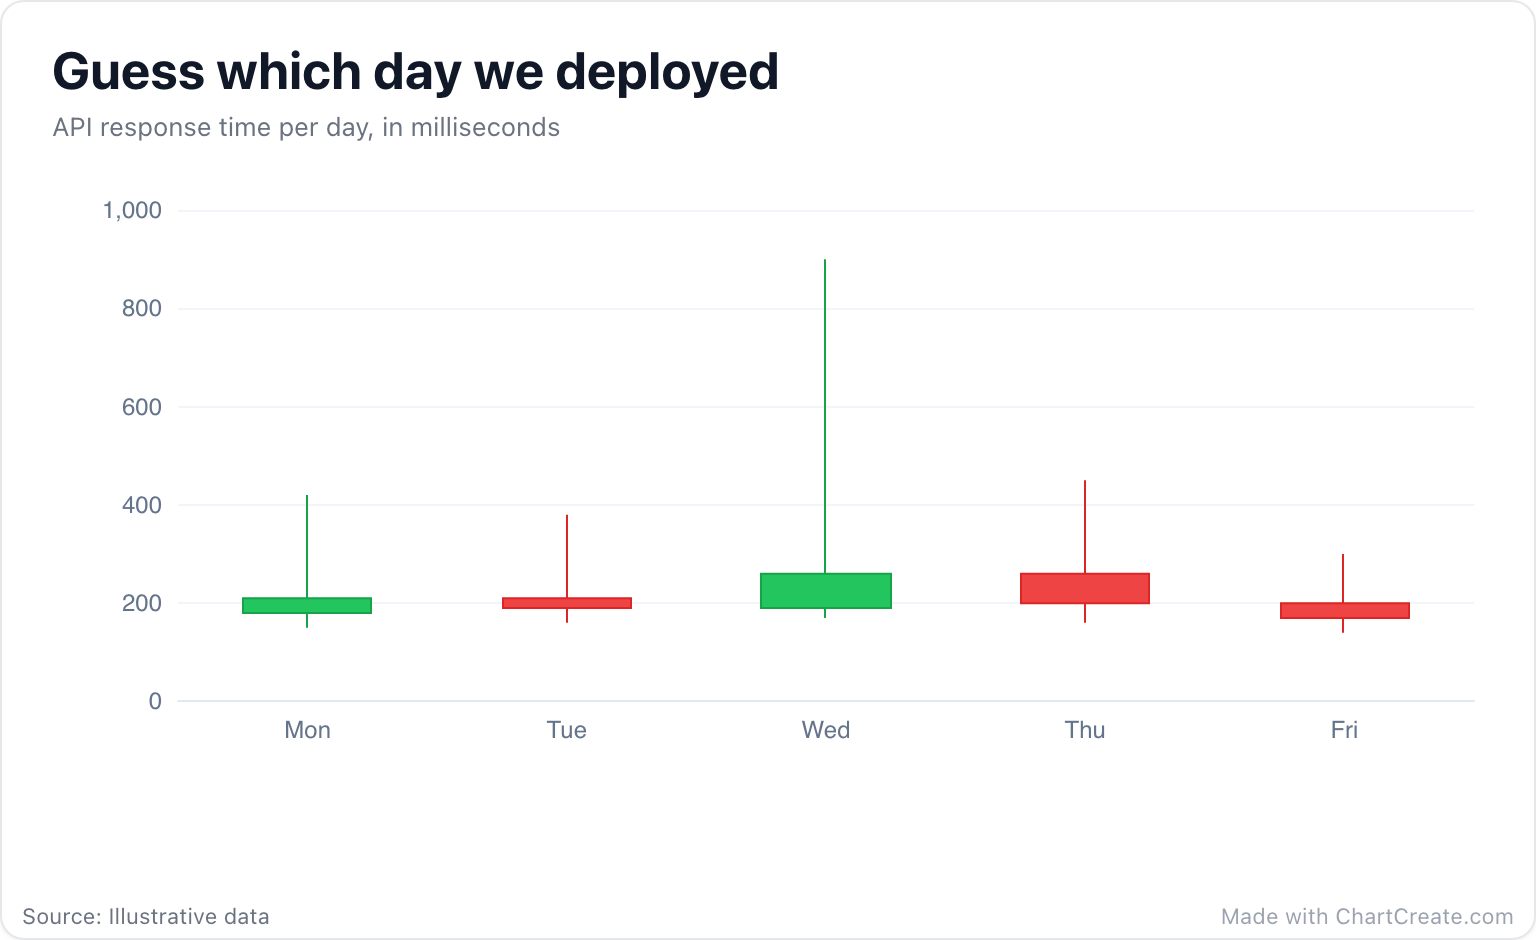
Anything with a start, an end and a range for each period fits: daily temperatures, the queue at the post office, server response times. Read the server example below the way you would read a stock: the first and last hour make the body, the fastest and slowest requests make the wicks. One day has a wick that stands out from the crowd, and you can probably guess what happened on it.
Keep it readable
Candles need elbow room. Somewhere between ten and sixty periods reads well; squeeze in a year of daily data and the candles shrink into a barcode. Put the unit in the subtitle (cents per pound, milliseconds, degrees) so nobody has to guess, and let the title say what happened rather than what the data is.
Make it yours
Give it columns for the date, open, close, low and high, in that order, and that is the whole setup. Paste them straight from a spreadsheet, set the number format, and export a crisp PNG or SVG for your report.