How to make a chord diagram that shows who connects with whom
A chord diagram sets a group of things around a circle and draws the connections between them across the middle. The strong relationships are the thick lines, and they are impossible to miss.
Every group sits on the rim as a dot, sized by the total of all its connections. Every connection is a curved line between two dots, and the thicker the line, the bigger the value. Because everyone sits on the same circle, nobody gets a privileged spot, and the eye goes straight to the thickest lines and the biggest dots. Classic chord diagrams draw links as wide ribbons. ChartCreate draws them as curved lines whose thickness carries the value, which stays readable even where several of them cross.
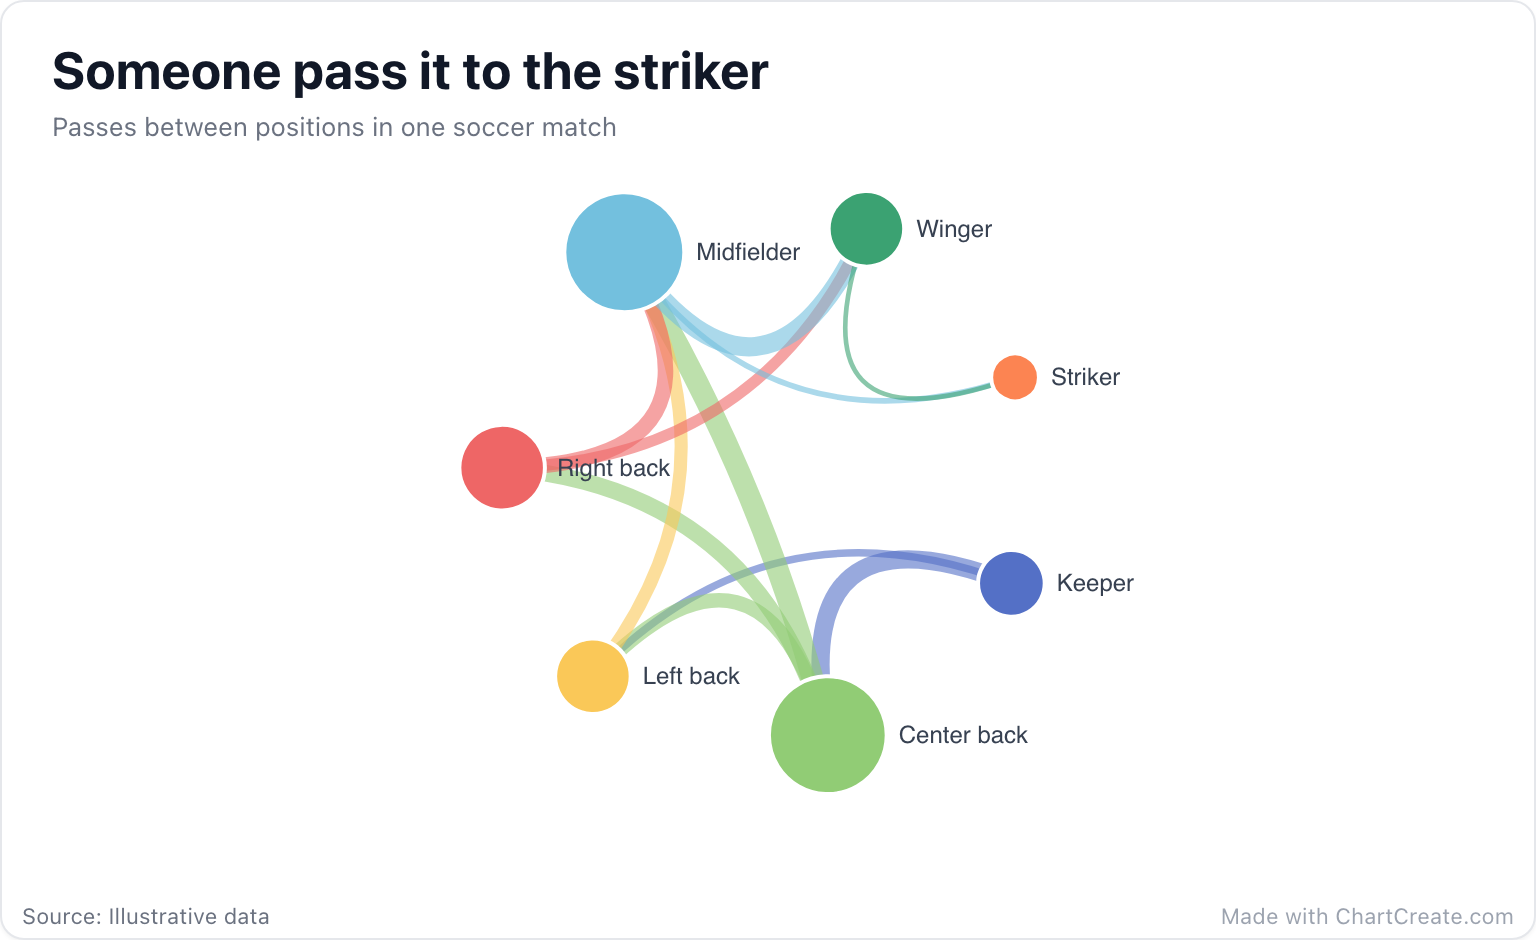
Reading the soccer example
Each line counts the passes between two positions in one match, in either direction. The biggest dots belong to the midfielder, involved in 72 passes, and the center back, with 70. The thickest line joins them: 22 passes. The keeper mostly plays it short to the center back, 18 of the keeper's 24 passes.
Then find the striker: the smallest dot on the circle, with 7 passes in total, 4 with the midfielder and 3 with the winger. If you are the coach, you don't need a spreadsheet to know what the halftime talk is about.
When to use a chord diagram
Use it when a modest number of groups, roughly four to ten, connect with each other and the strength of each connection matters: passes between players, trade between regions, students switching between majors, collaboration between teams. It is especially good when connections run every which way, including the loops a sankey diagram can't draw.
With more than a dozen groups the circle crowds and the lines tangle into a ball of yarn. If the direction of travel is the point, like money from donors to causes, a sankey diagram shows it explicitly. And if you have many nodes and care only about who is connected, not how strongly, a network graph lets the clusters form on their own.
Look at the thickest line first and the smallest dot second. That is usually the whole story.
Making one in ChartCreate
Enter one row per connection: a source, a target and a value. Swapping the two names doesn't change what the line means, so record each pair once with its combined total, the way the passing example does. Groups are placed around the circle in the order they first appear in your data, so start with the group you want first and keep related groups near each other.
Paste the three columns from a spreadsheet or import a CSV or XLSX file, and rename a group everywhere at once by clicking it in the editor's node list. Each group gets its own palette color, and each line takes the color of the first group named in its row, so pick a palette in the Style tab with clearly distinct colors. Hover over a dot to see its total, or over a line to see its value.
Common mistakes
Entering both directions as separate rows is the big one. A to B and B to A become two lines between the same pair, and each looks half as important as the real connection. Add them together first, unless the direction really is the story.
The other is a long tail of tiny groups. Ten groups with a value of one or two each turn into specks on the rim that nobody can read. Merge them into an "Other" group, or leave them out and say so in the subtitle.