How to make a line chart that shows what happened next
A line chart does one job better than any other chart: it shows how something changed over time, and how fast.
Put time along the bottom, the value up the side, and join the dots. The eye stops reading numbers and starts reading slope: a steady climb, a sudden jump, a slow fade. That is why a line chart is the first thing to try for anything measured at regular intervals, from monthly sales to daily step counts.
How to read it
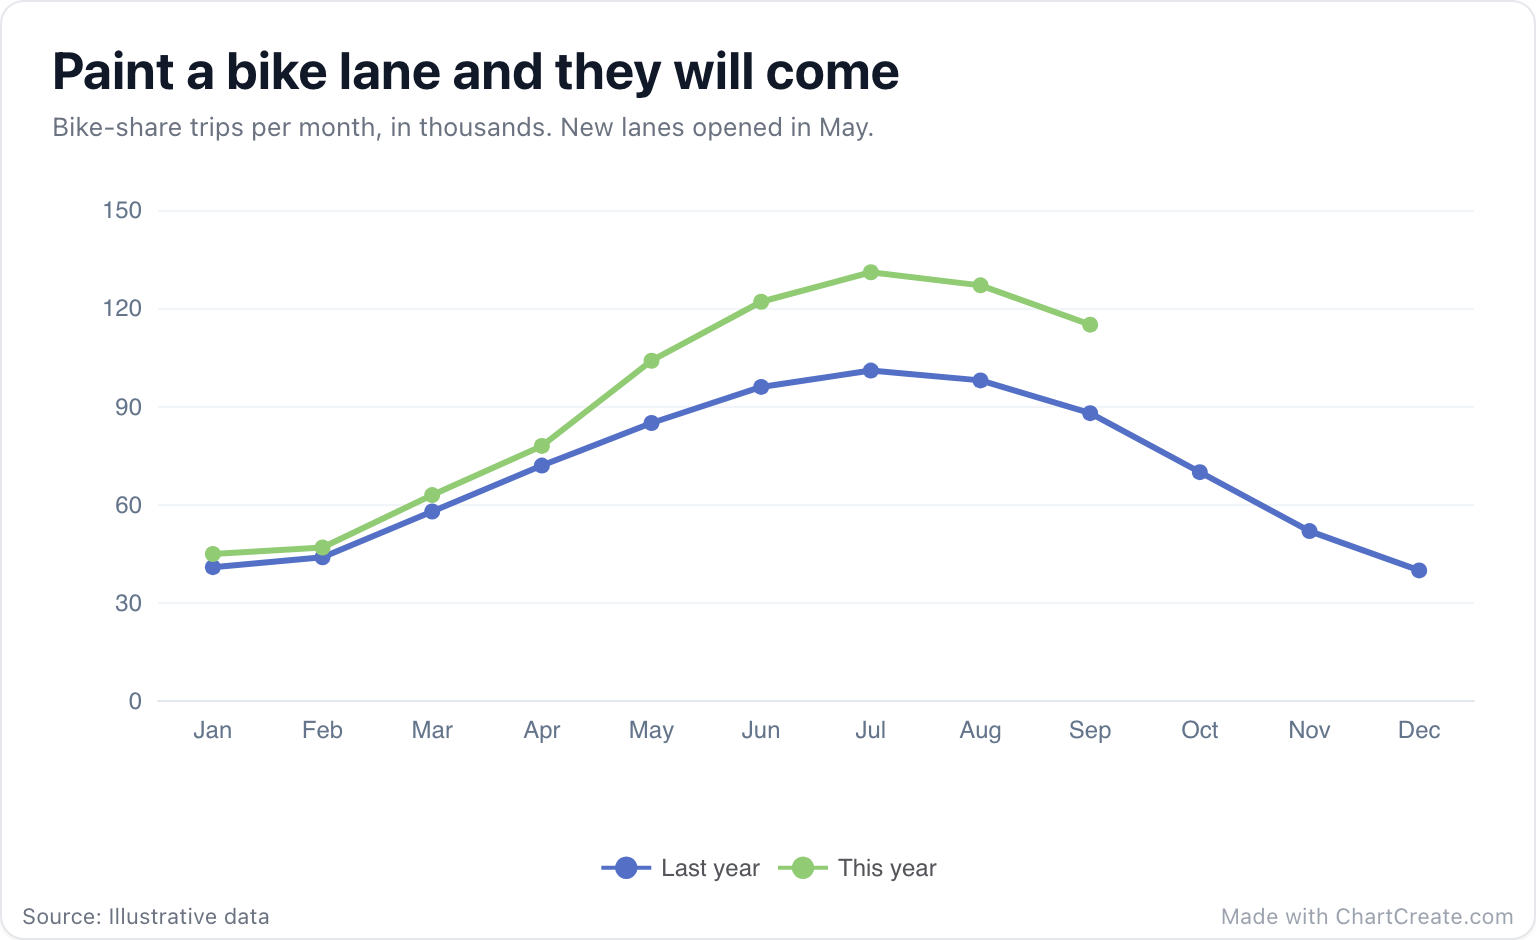
Read the shape before the numbers. In the bike-share chart both years climb the same seasonal hill, up in spring and down in autumn, so the season explains most of the movement. The interesting part is the gap. Until April the two lines almost touch. In May, the month the new lanes opened, this year pulls away and stays away: 104 thousand trips against 85, then 131 against 101 in July. Comparing a year with the one before is how you tell a real change from the weather doing its usual thing.
Bars compare things. Lines tell you what happened next.
When a line is the right call
Use a line when the horizontal axis is time, or anything else with a natural order, like age groups or price steps. Lines are also the best way to compare a few trends at once, because the shapes stay easy to tell apart even when they cross. Past four or five lines, though, you get spaghetti. Keep the ones that matter, or split them across a couple of charts.
If your categories have no order (products, countries, survey answers), use a bar chart instead: a line from "Apples" to "Bananas" suggests a journey that never happened. If you want to show how a total splits into parts over time, a stacked area chart does that. And if what matters is who is ahead rather than by how much, try a bump chart.
Making it in ChartCreate
The first column holds the time labels, and every column after it becomes a line named after its header. Add a column for each line, then paste your table from Excel or Google Sheets, or import a CSV or XLSX file. Missing values are fine: leave a cell blank and the line stops there instead of diving to zero, which is exactly what this year does above from October on.
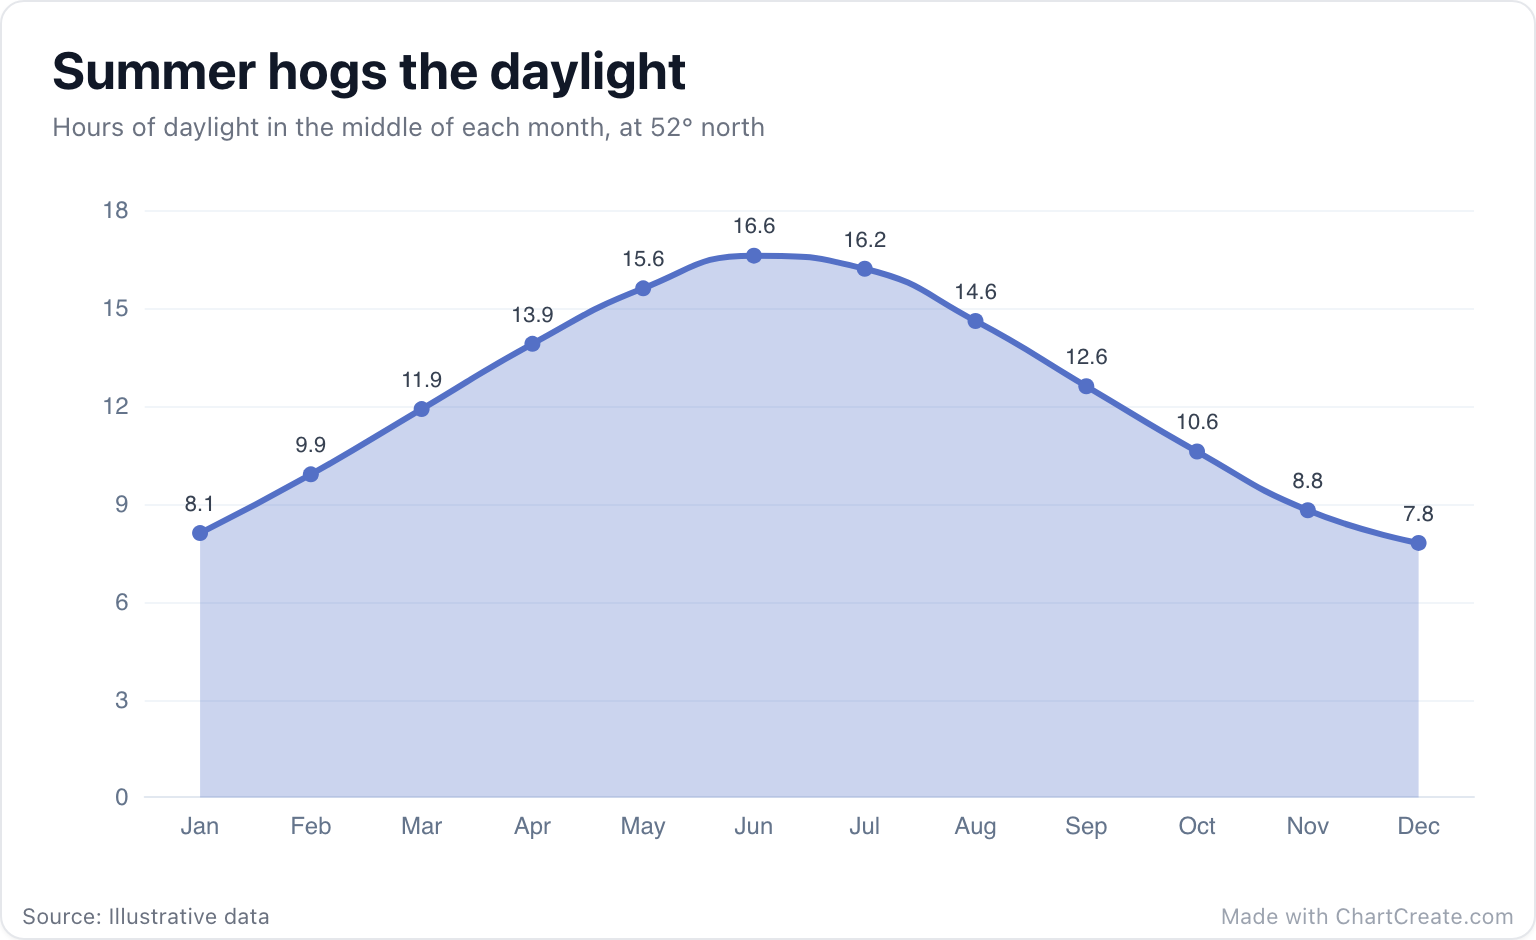
In the Style tab you can smooth the line, show or hide the points and pick their shape, switch to a dashed or dotted line, and shade the area underneath. Smoothing and a soft fill suit a gentle, cyclical story like the daylight chart below, where the overall wave matters more than any single month. Keep the line straight when every reading is real and you want people to see exactly where it turned.
Mistakes worth avoiding
Uneven time steps are the sneaky one. If your data jumps from 2010 to 2020 and then goes year by year, every step still gets the same width on the axis, and the slope lies. Fill in the missing years or make the jump obvious in the labels. The other classic is a data label on every point: on a long series with two lines they pile up into a gray smudge. Switch them off, as in the bike-share chart, and let the gridlines do the work.
Finally, a line chart does not have to start at zero, because it shows change rather than size. If the line hugs the top of a mostly empty chart, set your own minimum in the Axis & Grid section. Write a title that says what happened, put the unit in the description, and export a PNG, a sharp SVG, or a short video of the line drawing itself in.