How to make a radar chart that shows strengths at a glance
A radar chart, also called a spider chart, scores a few contenders on several traits at once and turns each one into a shape. You remember the shape long after you have forgotten the numbers.
Each spoke is a trait and each colored shape is one contender. The further a shape reaches along a spoke, the higher it scores on that trait, and joining the points gives every contender a silhouette. Strengths stick out as points, weaknesses show up as dents, and two contenders who are good at different things look different instantly, even when their totals are close.
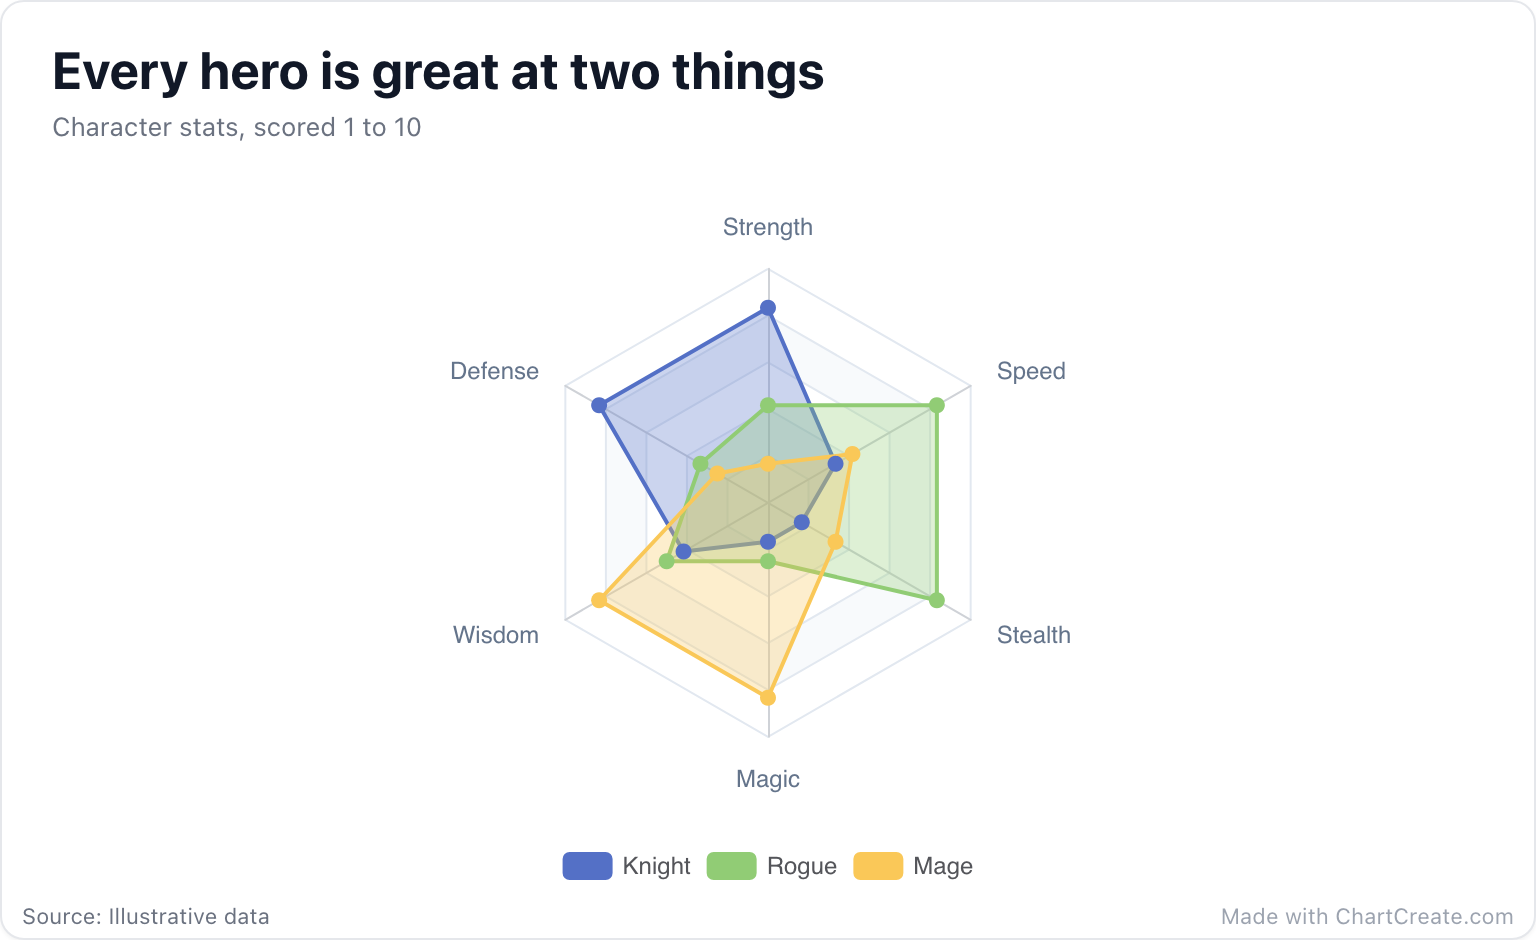
Reading the heroes
The knight, the rogue and the mage each score a perfect 10 on exactly two traits, and you can tell which two without reading a label: each shape bulges toward its own corner of the web. The knight leans into strength and defense, the mage into wisdom and magic, the rogue into stealth and speed. Look at what is left, too. Nobody scores above 6 outside their specialties, so this party needs all three of them.
Spoke order matters more than people expect. Related traits sit next to each other here, so each hero gets a clean, recognizable shape. Shuffle the same six rows and the same numbers turn into spiky stars that are much harder to tell apart.
A radar chart is a personality test for data. Read the shape, not the size.
When it works, and when bars are better
Radar charts are at their best with three to eight spokes and two or three shapes: character stats in a game, two products compared feature by feature, a team’s skills before and after training. Past three shapes the fills pile up into mud. For precise comparisons, or for ranking many items on one trait, a grouped bar chart is easier to read, because lengths along a straight line beat distances along a slanted spoke.
There is a subtler catch as well. The area of a shape grows faster than its scores, so a contender who is a little better everywhere looks a lot bigger overall. Use the shape to show character, not to crown an overall winner.
Making one in ChartCreate
Put the traits in the first column, one per row, and give each contender its own column of scores; the column names become the legend. You can type the table in or paste it from Excel or Google Sheets. Every shape gets a see-through fill so the overlaps stay visible, and the Radar Shape option switches the web between a polygon and a circle.
ChartCreate scales each spoke to its own highest value. That lets you mix units, like a price in dollars next to a rating out of five, without one spoke flattening the rest. The trade-off is that the leader on every spoke reaches the same distance from the center. When all your traits share one scale, like the heroes’ 1 to 10, the picture stays exact as long as the top score on each spoke is the same; every trait above has a 10.
The mistake to avoid
The classic radar mistake is mixing directions. If higher is better on every spoke except one, such as price or weight, that spoke quietly rewards the wrong contender. Turn it into something where more is better, like value for money or lightness, before you chart it, and the shapes will tell the truth.