How to make a Sankey diagram that shows where everything goes
A Sankey diagram follows a quantity from where it starts to where it ends up, and lets the width of each ribbon do the talking. Money, people, energy: if it splits and flows, it fits.
Every ribbon is one flow, from a source on the left to a target on the right, and its thickness is its size. The blocks where ribbons meet are called nodes. Because width is the only thing carrying the number, you read a Sankey by following the fat ribbons first and noticing where the thin ones peel off. The chart is named after Matthew Sankey, an Irish engineer who drew one in 1898 to show how much of a steam engine’s energy went to waste.
How to read one
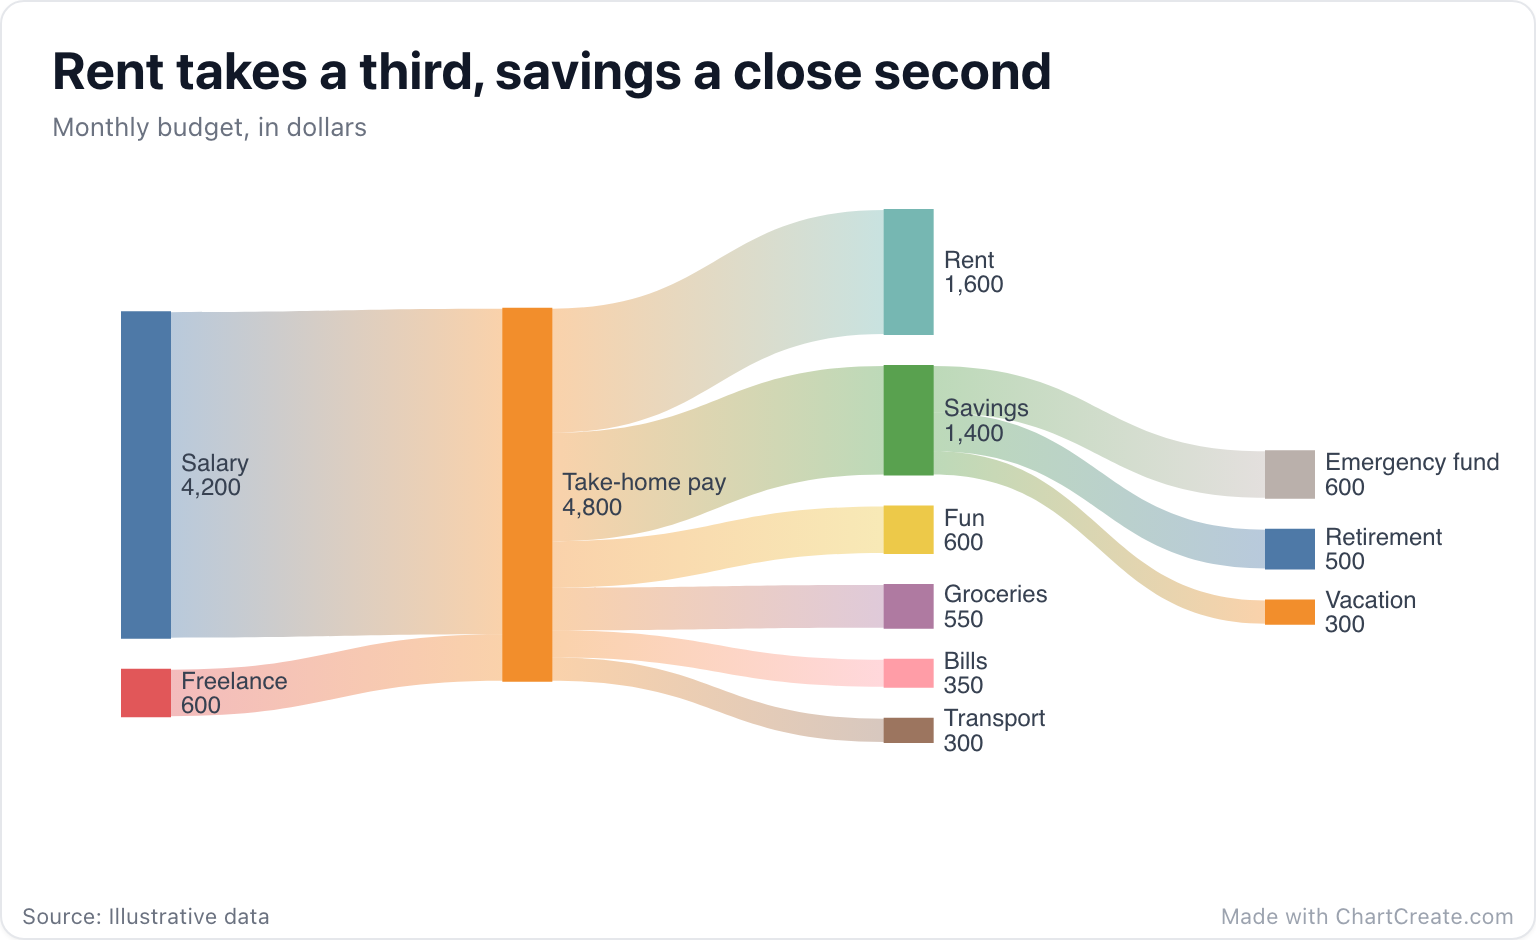
Start on the left and follow the money. Two streams, salary and freelance work, merge into $4,800 of take-home pay. From there it fans out, and the widths tell the story before you read a label: rent is the fattest ribbon leaving it, at exactly a third, savings is a close second, and transport is a thread. Savings then splits again into an emergency fund, retirement and a vacation, so you see not just how much is put aside but what it is for.
That second split is what a Sankey does better than anything else. A pie could show the six spending categories, but only a Sankey shows money moving through more than one stage while keeping every total in view. Each node is as tall as what passes through it, so the sizes add up wherever you look.
Follow the fattest ribbon first. It is almost always the story.
When to use it, and when not
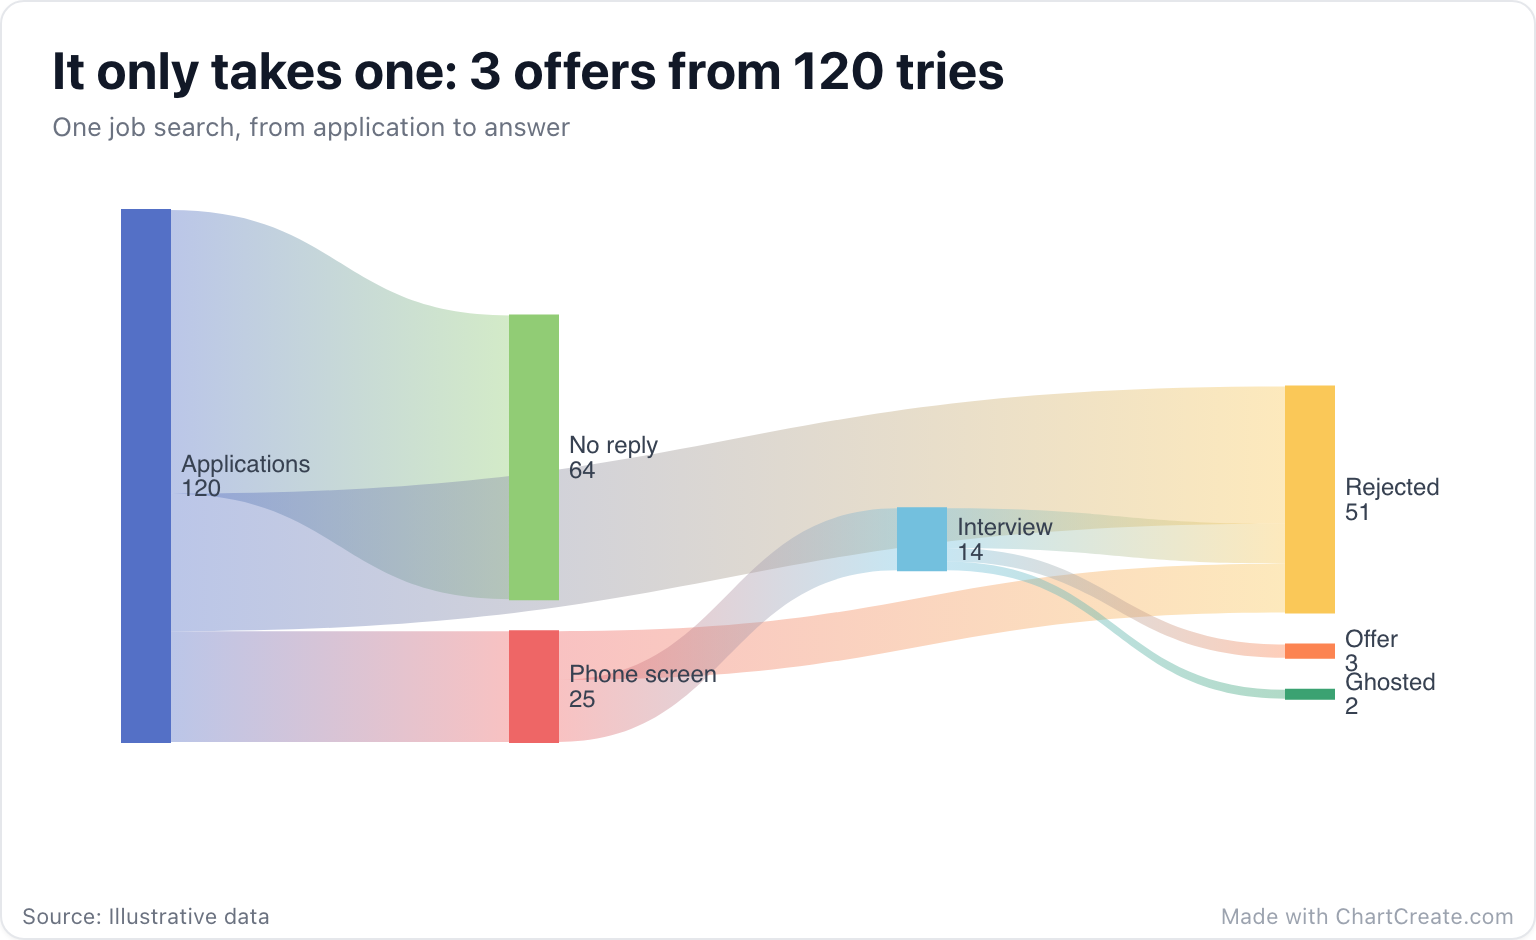
Reach for a Sankey when something splits, merges, or both, across two or more stages: a budget, energy from source to use, visitors moving through a website, students moving from one course to the next. It also makes a brutally honest record of a job search, the kind people share when the search is finally over.
If your steps form one straight line where people only ever drop out (visit, sign up, buy), a funnel chart says it more simply. If things flow both ways between the same groups, such as trade between countries, use a chord diagram, because a Sankey cannot loop back on itself. And if there is only one split, a pie or bar chart is usually enough.
Making one in ChartCreate
The data is a list of flows, one per row: where it comes from, where it goes, and how much. Type them into the flow editor, paste three columns straight from Excel or Google Sheets, or import a CSV or XLSX file. A new name creates a new node, and renaming a node in the list above the flows renames it in every flow at once, which saves a lot of find and replace. ChartCreate works out the columns for you, so a node fed by two earlier stages always sits to the right of both.
In the Style tab you can turn the diagram from horizontal to vertical, show the total on each node (on by default) or the amount on every ribbon, and widen the nodes or the gaps between them when the labels start to crowd. Nodes take the palette’s colors in the order they first appear in your list, and each ribbon fades from its source color to its target color.
Two mistakes to avoid
The first is a loop. A Sankey only flows forward, so a row that sends something back to an earlier node (an interview back to applications, say) cannot be drawn. ChartCreate leaves that row out and flags it in the editor instead of breaking the whole diagram. If your process really goes in circles, a network graph or a chord diagram is the better fit.
The second is flows that don’t add up. If 25 people reach the phone screen, the flows leaving it should total 25. When they don’t, the node stretches to fit the bigger side, its label still shows only what came in, and the picture stops adding up. Give the missing people a node of their own, like "No reply" and "Ghosted" above. The leftovers are often the most interesting part of the story.