How to make a scatter plot that shows if two things move together
A scatter plot is how you find out whether two things actually move together, or whether you just hoped they did.
Every dot is one thing measured twice: once along the bottom, once up the side. Put enough dots down and a shape appears. A cloud drifting up and to the right means the two numbers tend to rise together. Down and to the right means one falls as the other rises. A shapeless blob means there is no simple link, and that is a finding too.
How to read it
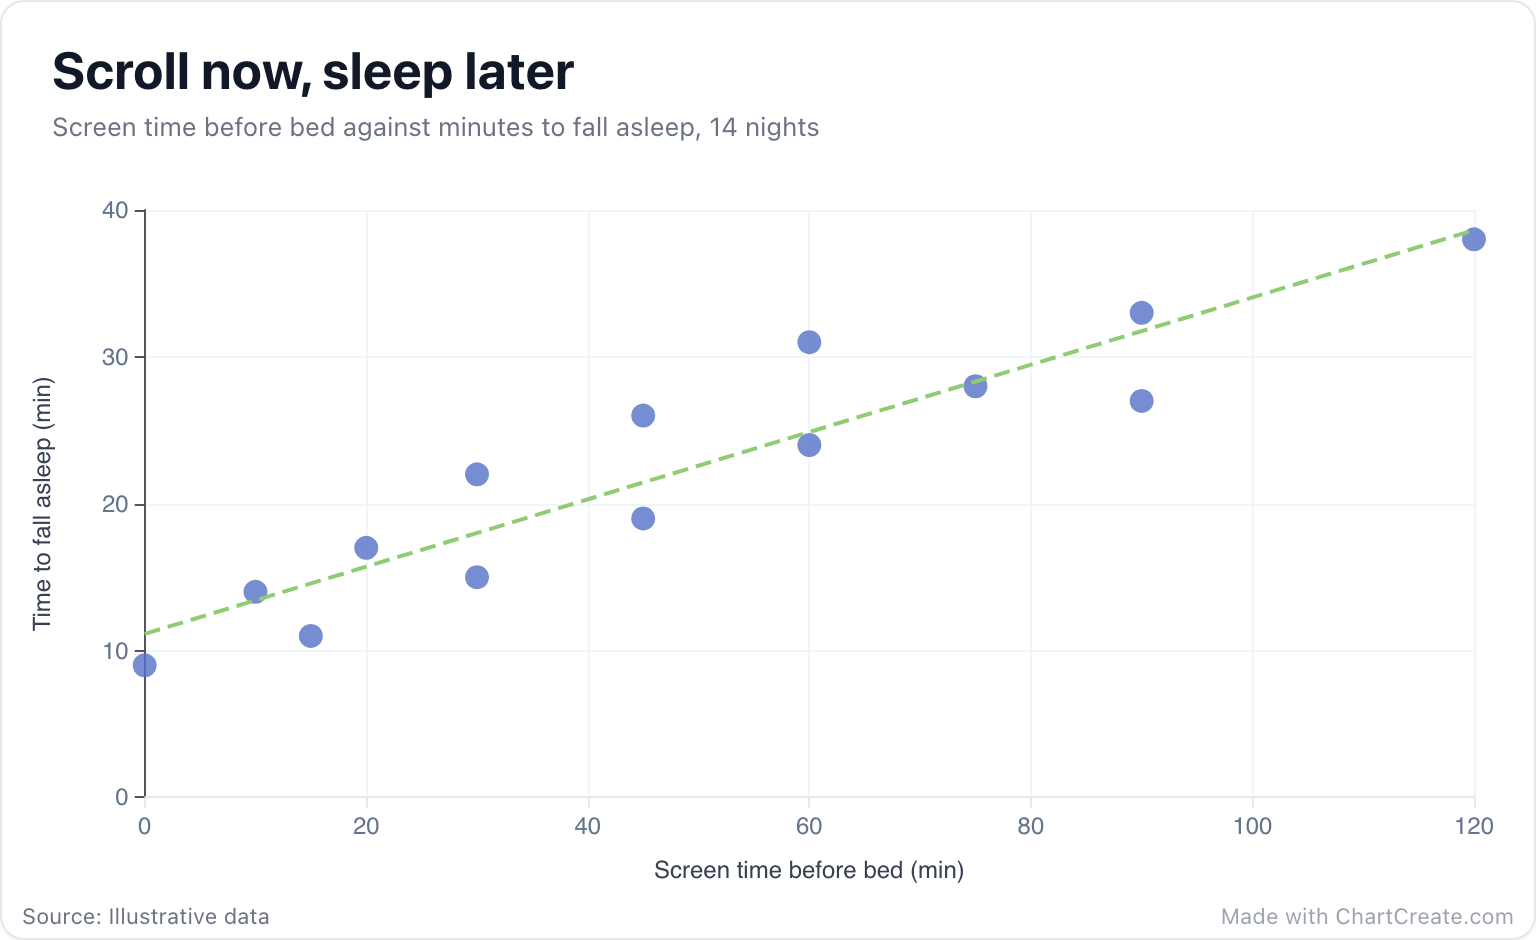
Look at the direction first, then the spread. In the screen-time example the dots climb: on the night with no screen at all, sleep came in 9 minutes, and after two hours of scrolling it took 38. The dashed trend line, a straight line fitted through all the points, makes the direction impossible to miss. Then look at how tightly the dots hug it. The two nights with 90 minutes of screen time took 27 and 33 minutes to fall asleep, so the link is real but loose. Screens are not the only thing keeping anyone awake.
A scatter plot can show you that two things move together. It cannot tell you which one is pushing.
When to use it
Use a scatter plot when both of your values are numbers and you want to see how they relate: price against rating, height against weight, ad spend against sales. It needs a fair number of points to show a pattern, ten at the very least. With only a handful, a table or a bar chart says more. And if one of your two values is time, you almost certainly want a line chart instead.
Bubbles: room for a third number
ChartCreate has two modes, switched at the top of the Data tab. Scatter mode takes plain X and Y pairs and draws every dot in the same color. Bubble mode adds a name and a size to each row, so every bubble gets its own color and label, and its size shows a third number. The trail example uses it: length along the bottom, climb up the side, and bubble size for how many people hike each trail on a weekend.
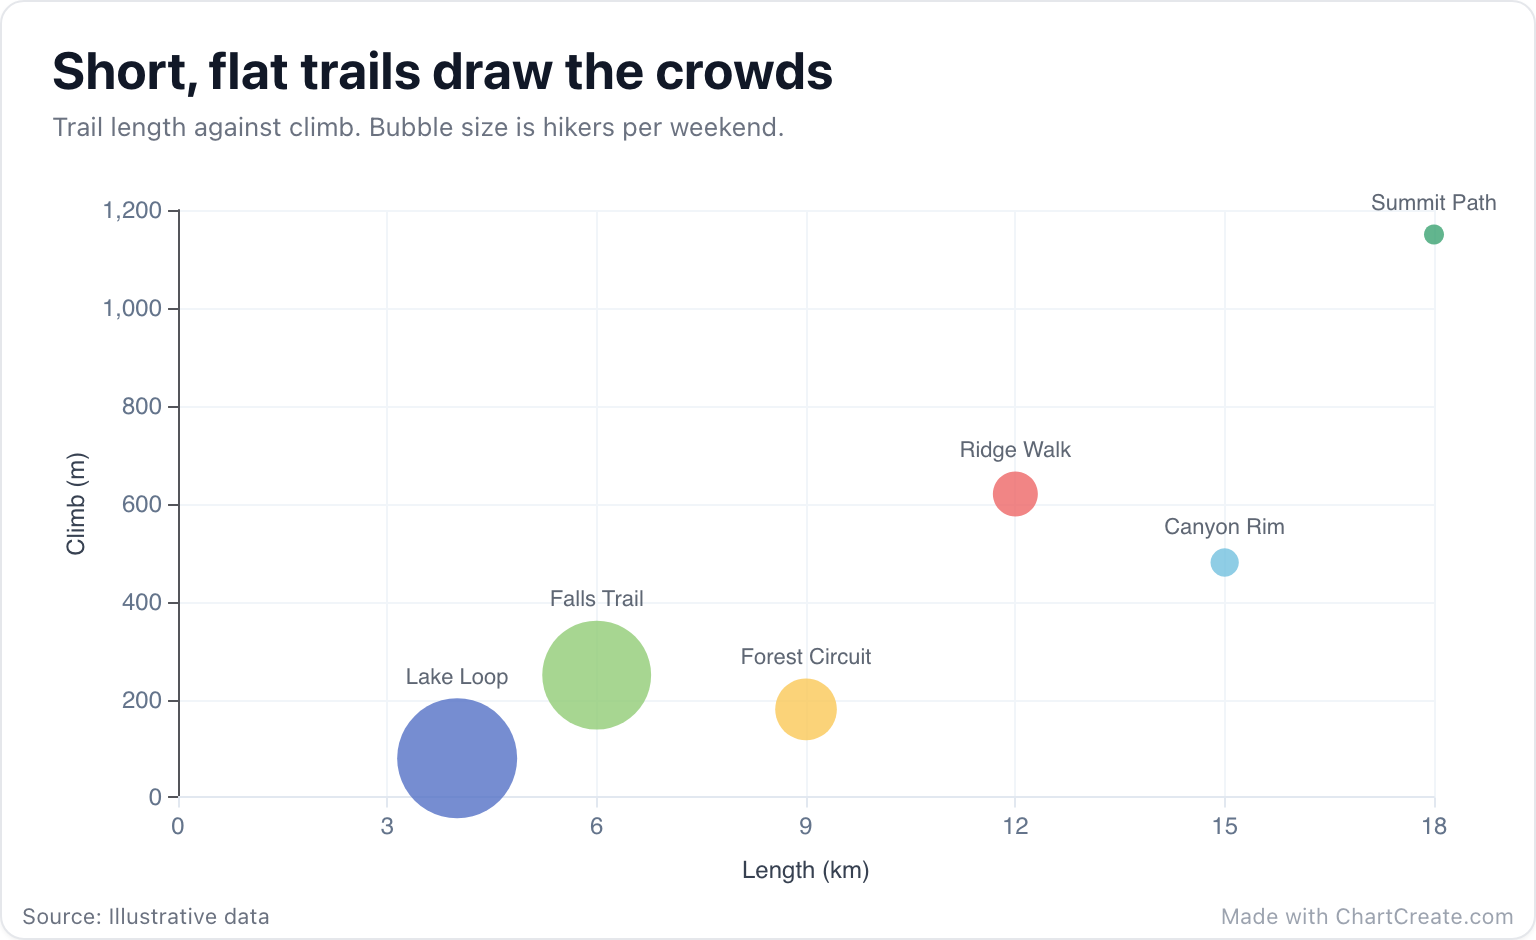
The story is in the corners. The two big bubbles sit bottom left, short and gentle. Summit Path, 18 kilometers and 1,150 meters of climbing, is a small dot alone in the top right corner, with 60 hikers on a weekend against 420 at Lake Loop. Read the sizes as bigger and smaller rather than exact amounts: ChartCreate scales them between the smallest and largest value in your data. Hover a bubble in the editor to see all three numbers.
Making it in ChartCreate
Paste two columns from Excel or Google Sheets, or four in bubble mode (name, X, Y and size), or import a CSV or XLSX file. The axis titles come from your column headers, so name them with their units, like "Climb (m)". Switch on Show Trend Line in the Style tab when the direction is the point, and set the number format once if you are plotting money or percentages: both axes follow. Then export a PNG, an SVG, or a short animated video.
Two mistakes to watch for. One is building a conclusion on a single outlier: a lone dot in a far corner is a story worth checking, not a trend. The other is trusting the trend line too far. It is always straight, so if your dots curve, the line still cuts right through them. Believe your eyes over the dashes.