How to make a stacked area chart that shows the total and the mix
A stacked area chart shows how a total splits into parts, and how that split shifts over time. Think of it as a line chart that swallowed a pie chart.
Each colored band is one part, drawn on top of the band below it. The top edge of the whole stack is the total, and the thickness of a band at any moment is that part's contribution. You get the big trend and the mix behind it in one picture, which is why the chart suits questions like "sales grew, but which products brought the growth?"
How to read it
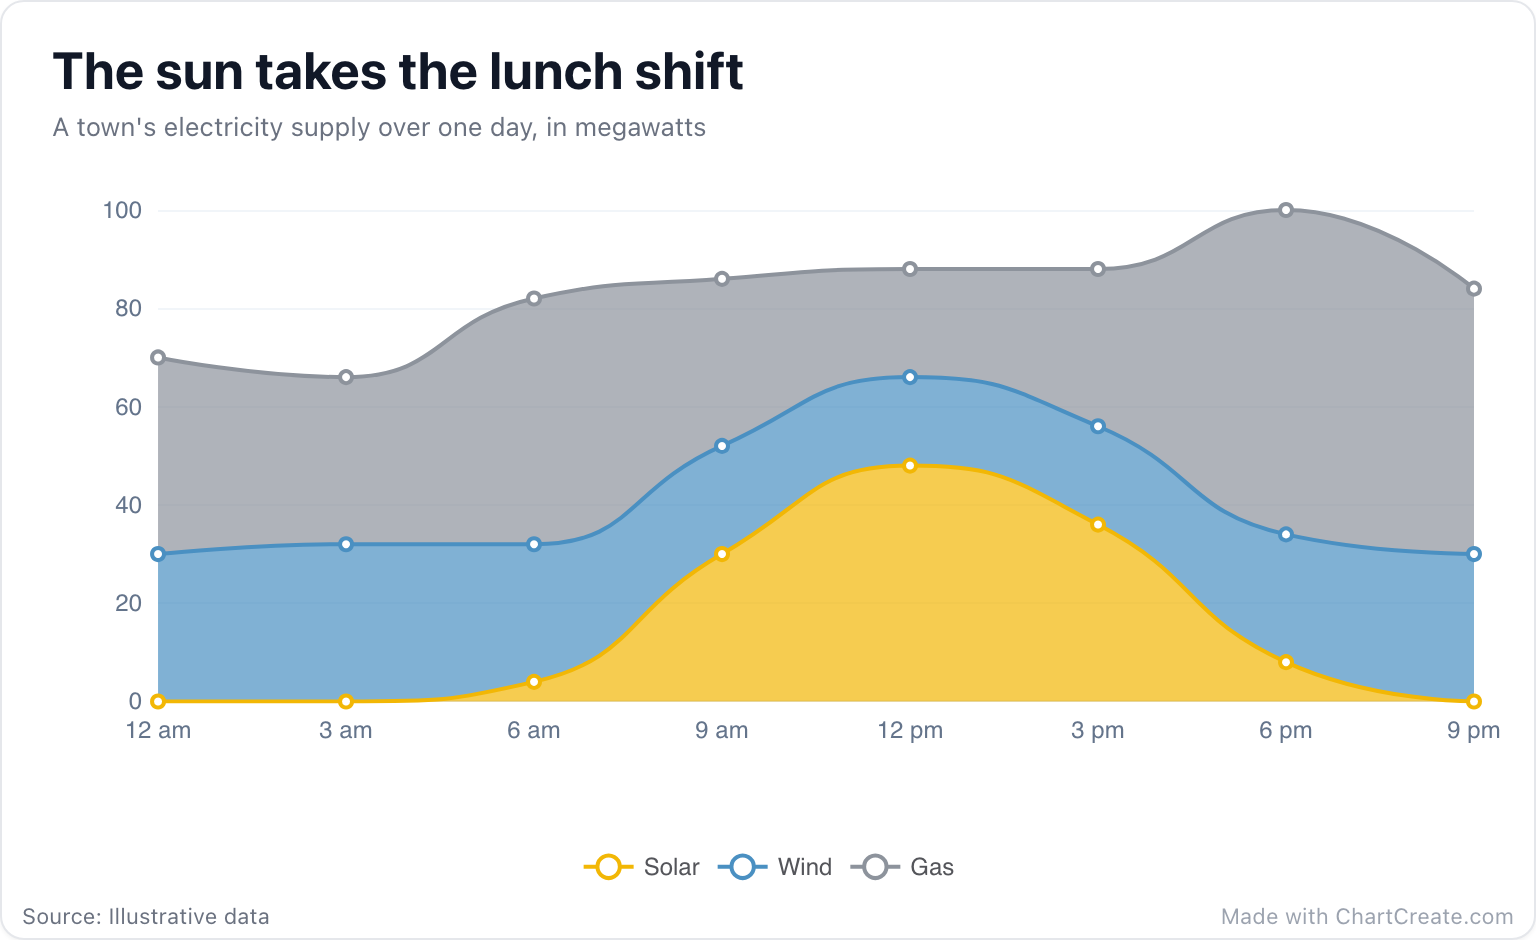
Read the top edge first. That is the total, lowest in the small hours (66 megawatts at 3 am) and highest at 6 pm (100 megawatts), when everyone gets home and switches on the oven. Then read the bands. Solar, at the bottom, draws a clean hill across the middle of the day, from 4 megawatts at 6 am to 48 at noon. Gas, on top, does the opposite: it shrinks to 22 at noon while the sun does the work, then swells to 66 in the evening once the sun has gone. One picture, two stories, and they explain each other.
Only the bottom band stands on flat ground
Here is the trade-off nobody mentions. The lowest band sits on a flat baseline, so its shape is easy to judge. Every band above it rides on the bumps of the ones below. Wind in the example is steady, between 18 and 32 megawatts all day, yet stacked on top of the solar hill it seems to climb a mountain at noon. The eye reads the outline, not the thickness.
Put the series you care about most at the bottom. Everything above it is riding a roller coaster.
In ChartCreate the first column after the time labels becomes the bottom band, so the order of your columns is a design decision. Solar goes first in the example because it is the story. Wind and gas are context.
When to use something else
Stacked areas work with two to four bands. Past five, the middle ones turn into thin ribbons nobody can compare. If the parts matter more than the total, a line chart with one line per part is easier to read, because every line is measured from zero. If you only have a handful of time points, a stacked bar chart says the same thing with less ink. And if the categories have no natural order, there is nothing for the bands to flow along, so stick to bars.
One more trap: only stack things that genuinely add up. Megawatts from different sources add up to total supply. Average prices, temperatures or percentages of different totals do not, and stacking them draws a total that means nothing.
Making it in ChartCreate
The data looks just like a line chart's: time labels in the first column, one column per band. Paste it from Excel or Google Sheets, or import a CSV or XLSX file. The curves come smoothed and the bands shaded. Turn data labels off when you have more than a few time points, since every band labels every point and the numbers soon pile up. Hovering a band in the editor highlights it and fades the others, which helps when you are checking a value.
Color does a lot of work here. Neighboring bands need clearly different colors, and if the parts have natural colors, use them. The example sets its own under Custom Colors: yellow for the sun, blue for the wind, gray for gas. Click any swatch there to pick a color. Then give the chart a title that states the finding, put the unit in the description, and export a PNG, an SVG, or a short animated video.