How to make a theme river chart that shows the ebb and flow
A theme river, also called a streamgraph, is a stacked area chart that has let go of the floor. Its bands flow around a center line, swelling and thinning as each category has its moment.
Each category is a colored stream, and its thickness at any point in time is its value. The streams are stacked, but instead of resting on a flat baseline, the whole stack is centered, so it ripples like a river seen from above. The full width of the river at any moment is the total. What it gives up is exact reading: there is no vertical axis to measure against, so it shows rhythm and proportion rather than precise numbers.
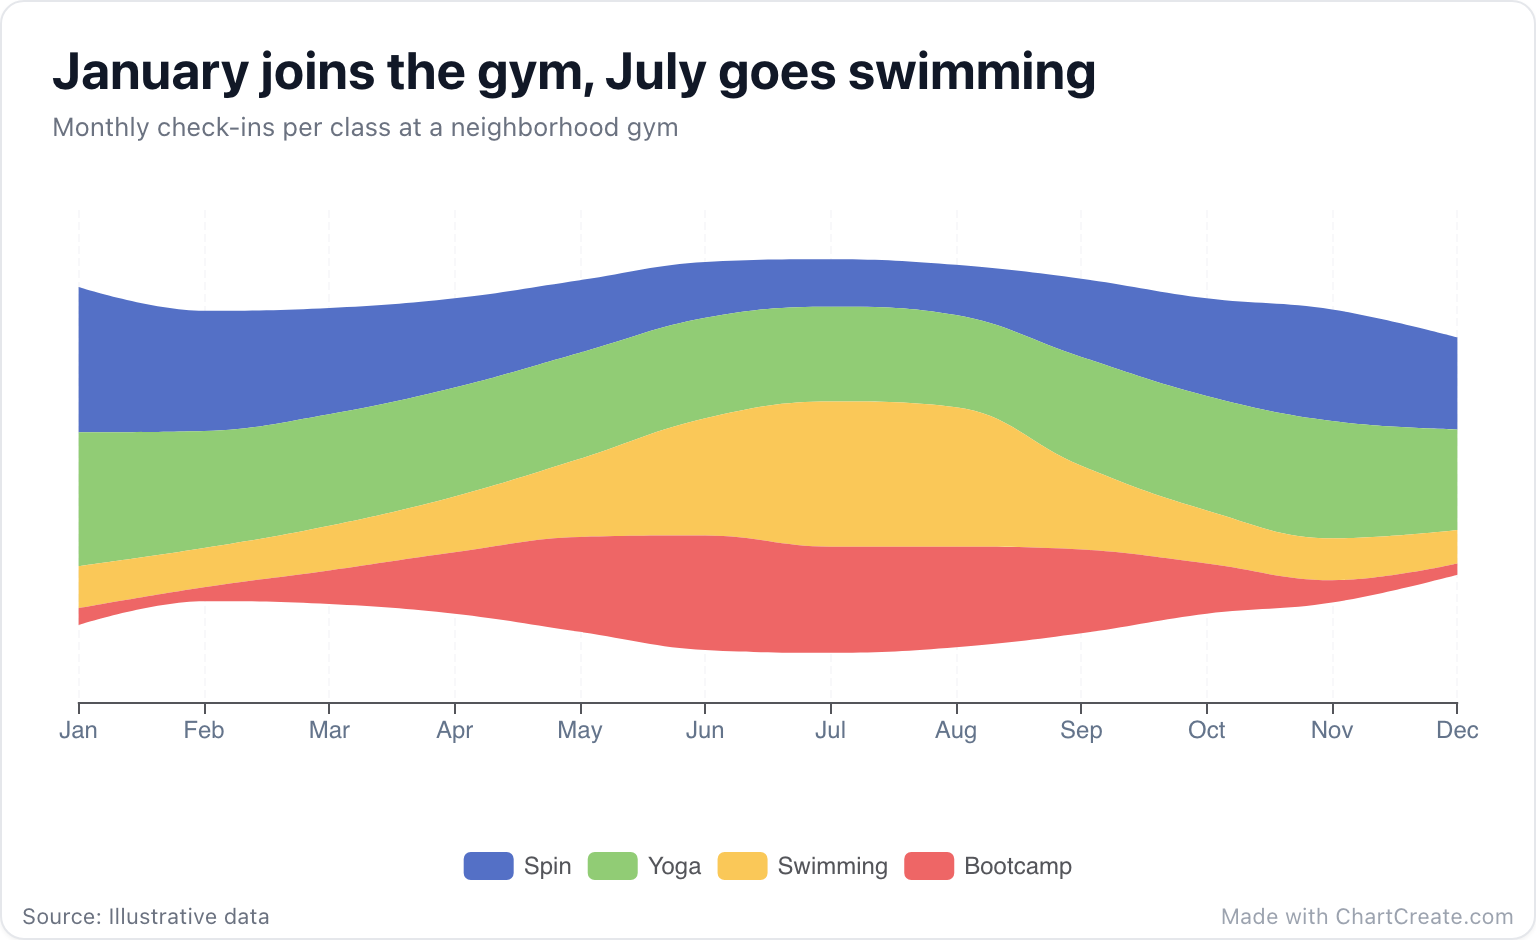
What the gym example shows
In January the river is fat with Spin and Yoga, at 520 and 480 check-ins: the resolution crowd has arrived. By summer the picture has flipped. Spin thins to 170 in July, while Swimming swells to 520 and the outdoor Bootcamp class peaks at 410 in June.
Yoga barely moves all year, a steady band between 330 and 480 check-ins: the regulars, who never needed a resolution. In December the whole river narrows to its thinnest point, 850 check-ins in all, because everyone is at a party. You can read that story in a few seconds. Digging it out of a table of 48 numbers would take a lot longer.
When to use it, and its limits
A theme river shines for a handful of categories changing over time, especially when they peak at different moments: topics in the news, genres in a year of listening, products across the seasons. It is decorative in the best sense, a natural fit for the cover of a report or a social post. Keep it to about three to seven streams. With a dozen, the thin ones vanish between the thick ones.
If the exact numbers matter, use a stacked area chart, which keeps a flat baseline and a vertical axis. If you want to compare the categories with each other rather than see the whole, a line chart with one line per category is clearer.
A theme river shows the shape of a year, not the number for a month.
Making one in ChartCreate
This chart wants long data: one row per category per period, in three columns for the period, the value and the category. Twelve months of four classes makes 48 rows. That is the layout most databases and many spreadsheets export anyway, so the quickest way in is to paste the three columns or import a CSV or XLSX file.
Periods can be real dates, such as 2025 or 2025-03, which go on a time axis. Or they can be plain labels like Jan or Week 3, which are spaced evenly in the order they first appear in your data. In the Style tab, pick a palette with clearly different colors, since neighboring streams need to stand apart, and leave the legend on so readers can match colors to names. Hover over the river in the preview to see every stream's value at that point in time.
Common mistakes
Leaving gaps is the first. Give every category a value in every period, even when it is zero, as the gym data does for every class in every month. Missing rows can make the streams misbehave.
The second is shuffled periods. Label periods are placed in the order they first appear, so sort your rows by period before you paste them, or December may end up somewhere in spring. The third is using it for data that doesn't really move. A river with four straight bands is just a slow stacked bar.