How to make a US map that shows more than population
A US map colors each state by your data. Done well, it reveals a regional pattern at a glance. Done carelessly, it shows where Americans live, one more time.
Why so many US maps look the same
Color the states by a raw count, almost any count, and California, Texas, Florida and New York light up. Not because anything special is happening there, but because that is where the people are. Coffee shops, parking tickets, pet adoptions: the totals all draw the same map.
The fix is to divide before you color. Map a rate, per person, per 100,000 people or per household, and a small state with a lot going on can finally outshine a big one.
A map of totals is usually a map of population. Divide first.
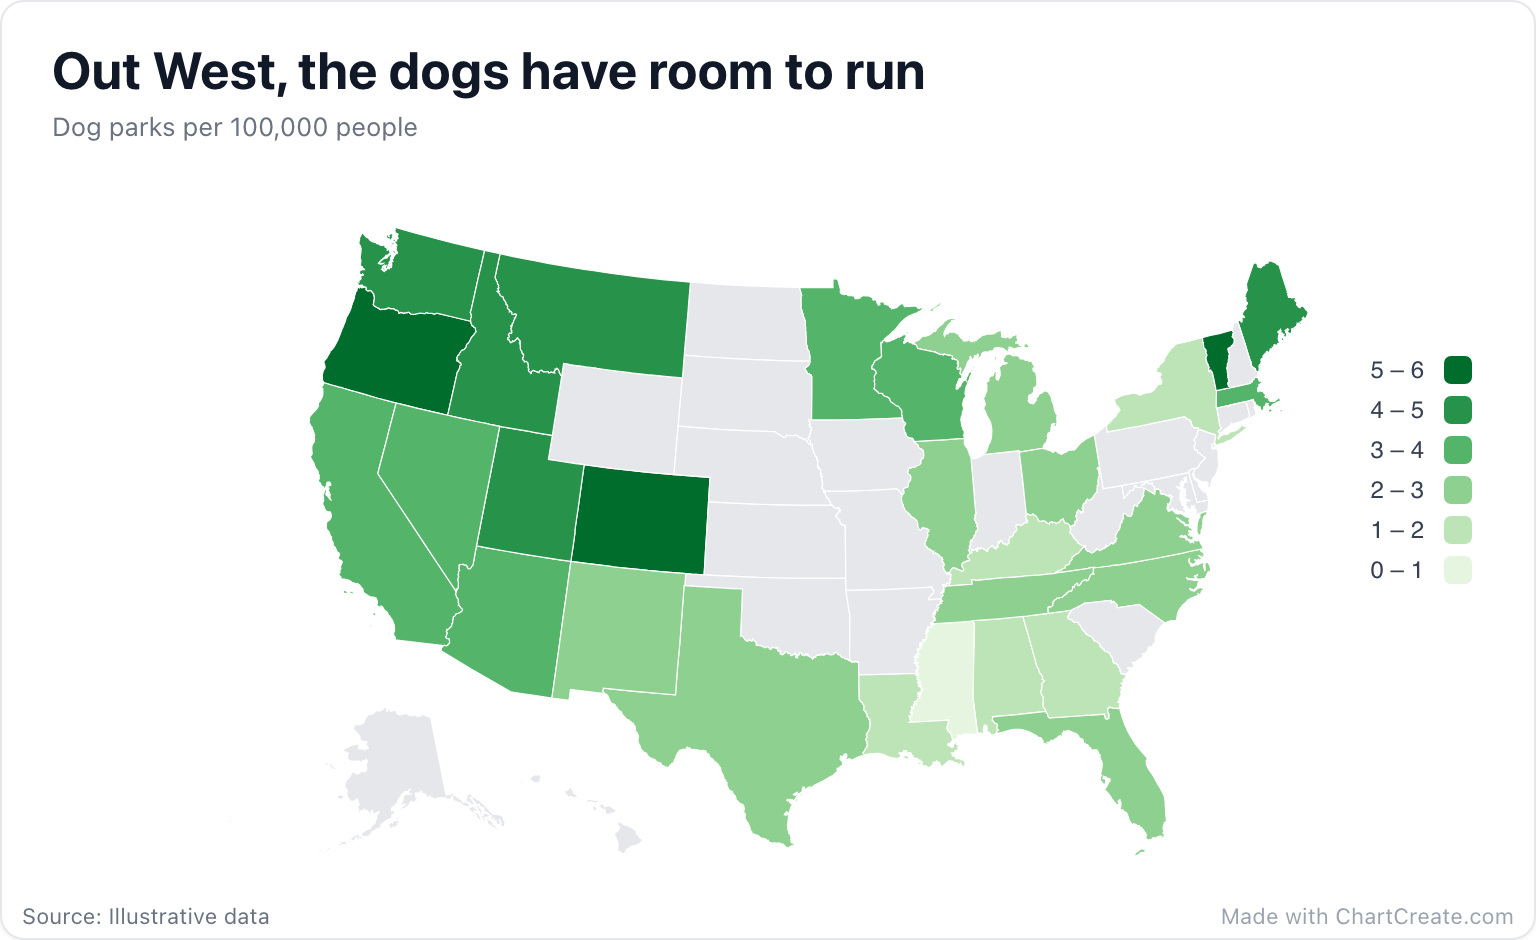
In the dog park map, Oregon tops the scale at 5.8 parks per 100,000 people and Mississippi sits at the bottom with 0.9. California, which would win easily on raw totals, lands mid-pack at 3.1. The pattern that appears instead is regional: dark green across the Northwest and the Rockies, with Vermont and Maine keeping up in the Northeast. The gray states simply have no row in the data, and the map says so honestly instead of guessing.
Typing states
Use full state names or two-letter postal codes, in any case: OR, co and Vt all work, and so do DC and "Washington DC". Paste two columns from Excel or Google Sheets, or import a CSV or XLSX file. Numbers can keep their formatting, so "1,250", "12%" and "$40" are all read as numbers. Any row that matches no state is highlighted in amber in the Data tab instead of silently vanishing.
The map uses the Albers projection that suits the lower 48, with Alaska and Hawaii drawn as insets along the bottom left, so there is no projection menu to worry about. The legend sits on the right, over the Atlantic, where nothing else needs the space.
A legend people can actually read
By default the scale splits the range of your data into four equal steps, which tends to produce boundaries with two decimals that nobody can remember. Set Scale min and max in the Map section to round numbers, pick a step count that divides evenly, and the legend reads like a ruler: 0 to 1, 1 to 2, all the way to 5 to 6. That is how the dog park map is set up, with six steps.
Stepped scales usually beat the smooth gradient. With a handful of classes, a reader can match a state to the legend; with a gradient, they guess. For the colors, Color scale offers Blues, Greens, Reds, Purples, Heat and Yellow-blue for data that only goes up, plus Red to blue for data that runs either side of a middle. Values on map prints each number on its state, which works on the big western states and gets cramped among the small ones in the Northeast.
When a map is not enough
A map is for regional patterns: the West against the South, the coasts against the middle. If your reader needs to compare Ohio with Michigan precisely, or rank all fifty states, a bar chart sorted from highest to lowest does that job better. Data by county or city needs a more detailed map than this one, since the US map stops at states.
When it is ready, download a PNG, JPG or SVG, with sizes ready for Instagram, X or a 1920 by 1080 slide. It is free with no account, and every export carries a small "Made with ChartCreate.com" credit.