How to make a waterfall chart that explains the bottom line
Revenue was $120,000 and you kept $55,000. A waterfall chart shows exactly where the other $65,000 went, one step at a time.
A waterfall chart starts with a value, walks through everything that pushed it up or down, and lands on the result. Each step is a floating bar that begins where the previous one ended. Gains rise in green, losses drop in red, and the total at the end stands on the ground in gray. Read it left to right like a story: here is where we started, here is what happened, here is where we ended up.
Reading the indie game example
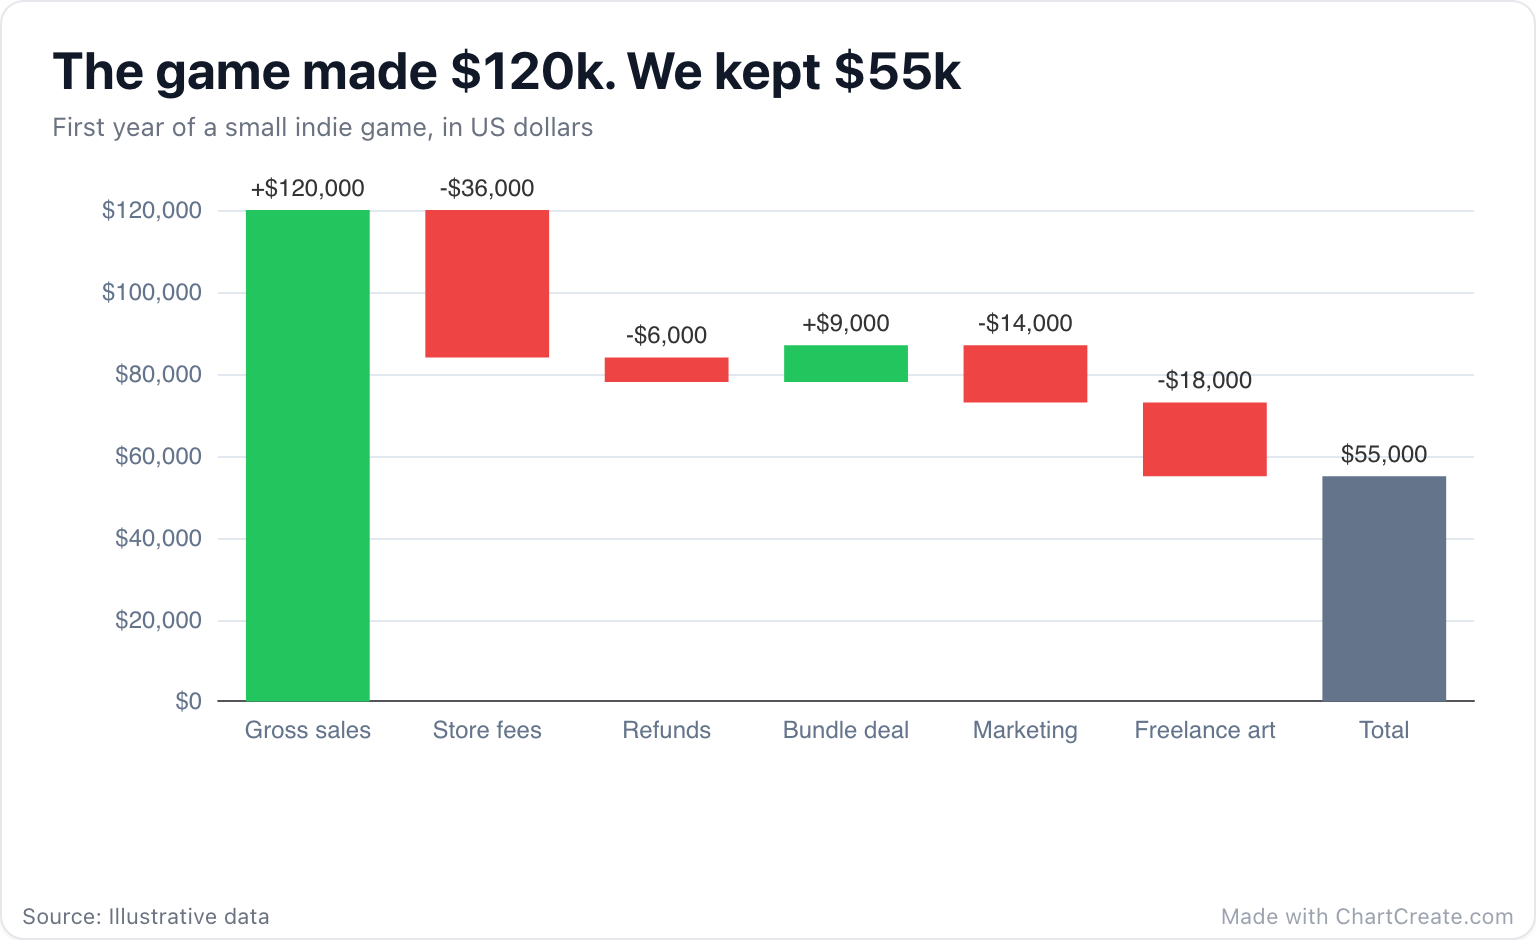
The first bar is the $120,000 the game earned in its first year. Then the deductions begin. The store takes $36,000, refunds claw back $6,000, a bundle deal brings $9,000 back in, and marketing and freelance art cost $14,000 and $18,000. The gray Total bar lands at $55,000.
Both numbers are on the chart, the one in the press release and the one in the bank, along with every reason they differ. The biggest bite is obvious at a glance, too: the store's cut alone is larger than marketing and art put together. Nobody has to ask where the money went.
When to use a waterfall, and when not to
Use it whenever a total changes for named reasons. A profit bridge from revenue to net income. This year's budget against last year's. A team that started the year at 40 people and ended at 46 after hires and departures. A paycheck shrinking on its way to the savings account. The steps should add up, and their order should make sense to the reader: usually the order things happen, or biggest first.
Skip it when your numbers are not a chain of changes. Comparing sales across five regions is a job for a bar chart. Tracking a balance over twelve months is a line chart, which shows the trend better. And if you want the share each cost takes of the whole, a pie chart or a treemap says that more directly.
A good waterfall answers one question before anyone asks it: where did the difference go?
Making one in ChartCreate
Enter one row per step: a name and an amount, with costs as negative numbers. The first row is your starting value. Leave Show Total Bar switched on in the chart options and ChartCreate adds a Total bar at the end with the running total. You can type the rows, paste two columns straight from Excel or Google Sheets, or import a CSV or XLSX file.
For money, set the number format to Currency in the Display options and choose your symbol. Every bar is labeled with its change, sign included, so readers see +$9,000 and -$14,000 rather than guessing from the color. If a run of losses drags the total below zero, the bars still start from the running total and cross the axis where they should, which is handy for the quarters a project spent underwater. Export a PNG for slides or an SVG for a crisp report.
Three common mistakes
Entering costs as positive numbers is the classic. ChartCreate can't know that "Refunds" is bad news, so the step goes up in green and the ending looks wonderfully, wrongly optimistic. Put a minus sign on every cost.
The second is typing your own total as the last row. Every row is treated as a step, so a "Net profit" row adds itself on top of everything before it and doubles your result. Let the Total bar do the adding. The third is subtler: your opening value is a step like any other, so it rises from zero in green. Give it a plain name, like "Gross sales" or "Starting budget", so nobody mistakes it for a gain.